

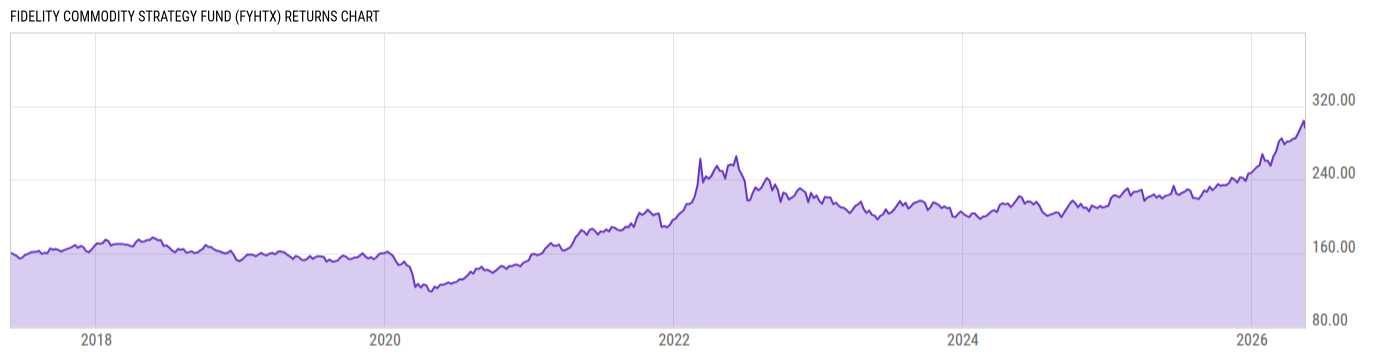
Fidelity Commodity Strategy Fund (FYHTX)
118.43
-1.20
(-1.00%)
USD |
Jun 09 2026
Returns Chart
Key Stats
| Net Expense Ratio | Total Assets Under Management | Weighted Average Dividend Yield | Turnover Ratio (Generic) |
|---|---|---|---|
| 0.63% | 232.21M | -- | 0.00% |
| 1 Year Fund Level Flows | 1 Year Total Returns (Daily) | Annualized Total Returns Since Inception (Daily) | Max Drawdown (Since Inception) |
| 125.86M | 25.82% |
Basic Info
| Investment Strategy | |
| The Fund seeks to provide investment returns that correspond to the performance of the commodities market. It invests in commodity-linked derivative instruments, short-term investment-grade debt securities, cash, and cash equivalents. Invests 25% of assets in subsidiary that invests in commodity-linked total return swaps. |
| General | |
| Security Type | Mutual Fund |
| Equity Style | -- |
| Broad Asset Class | Commodities |
| Broad Category | Real Assets |
| Global Peer Group | Commodity Blended |
| Peer Group | Commodities General Funds |
| Global Macro | Commodity Blended |
| US Macro | Commodities Funds |
| YCharts Categorization | -- |
| YCharts Benchmark | -- |
| Prospectus Objective | Commodities Funds |
| Fund Owner Firm Name | Fidelity Investments |
| Broad Asset Class Benchmark Index | |
| ^BCTR | 100.0% |
Net Fund Flows Versus Peer Group
1 Month
% Rank:
9
-267.38M
Peer Group Low
225.86M
Peer Group High
1 Year
% Rank:
22
125.86M
-1.413B
Peer Group Low
2.317B
Peer Group High
3 Months
% Rank:
21
-424.27M
Peer Group Low
914.54M
Peer Group High
3 Years
% Rank:
20
-2.785B
Peer Group Low
2.546B
Peer Group High
6 Months
% Rank:
19
-1.287B
Peer Group Low
1.516B
Peer Group High
5 Years
% Rank:
22
-7.491B
Peer Group Low
2.625B
Peer Group High
YTD
% Rank:
20
-460.54M
Peer Group Low
1.296B
Peer Group High
10 Years
% Rank:
23
-4.281B
Peer Group Low
3.873B
Peer Group High
Date Unavailable
Risk
Performance Versus Peer Group
Annual Total Returns Versus Peers
As of June 10, 2026.
Asset Allocation
As of April 30, 2026.
| Type | % Net |
|---|---|
| Cash | 31.32% |
| Stock | 0.00% |
| Bond | 62.78% |
| Convertible | 0.00% |
| Preferred | 0.00% |
| Other | 5.90% |
Top 10 Holdings
| Name | % Weight | Price | % Change |
|---|---|---|---|
|
Fidelity Cash Central Fund
|
90.54% | -- | -- |
|
Merrill Lynch International/Bloomberg Commodity Index 3 Month Forward Total Return Index TRS
|
21.18% | -- | -- |
|
Royal Bank of Canada/Bloomberg Commodity Index 3 Month Forward Total Return Index TRS
|
19.20% | -- | -- |
|
JPMorgan Chase Bank NA/Bloomberg Commodity Index 3 Month Forward Total Return TRS
|
8.75% | -- | -- |
|
Goldman Sachs Bank USA/Bloomberg Commodity Index 3 Month Forward Total Return TRS
|
8.51% | -- | -- |
|
Canadian Imperial Bank of Commerce/Bloomberg Commodity Index 3 Forward Total Return TRS
|
8.10% | -- | -- |
|
Citibank NA/Bloomberg Commodity Index 3 Month Forward Total Return Index TRS
|
4.76% | -- | -- |
|
100 GOLD DEC26
|
3.87% | -- | -- |
|
BRENT CRUDE NOV6
|
3.11% | -- | -- |
|
LIGHT CRUDE SEP6
|
2.60% | -- | -- |
Fees & Availability
| Fees | |
| Actual 12B-1 Fee | -- |
| Actual Management Fee | 0.40% |
| Administration Fee | -- |
| Maximum Front Load | -- |
| Maximum Deferred Load | -- |
| Maximum Redemption Fee | -- |
| General Availability | |
| Available for Insurance Product | No |
| Available for RRSP | No |
| Purchase Details | |
| Open to New Investors |
|
| Minimum Initial Investment | 0.00 None |
| Minimum Subsequent Investment | 0.00 None |
Basic Info
| Investment Strategy | |
| The Fund seeks to provide investment returns that correspond to the performance of the commodities market. It invests in commodity-linked derivative instruments, short-term investment-grade debt securities, cash, and cash equivalents. Invests 25% of assets in subsidiary that invests in commodity-linked total return swaps. |
| General | |
| Security Type | Mutual Fund |
| Equity Style | -- |
| Broad Asset Class | Commodities |
| Broad Category | Real Assets |
| Global Peer Group | Commodity Blended |
| Peer Group | Commodities General Funds |
| Global Macro | Commodity Blended |
| US Macro | Commodities Funds |
| YCharts Categorization | -- |
| YCharts Benchmark | -- |
| Prospectus Objective | Commodities Funds |
| Fund Owner Firm Name | Fidelity Investments |
| Broad Asset Class Benchmark Index | |
| ^BCTR | 100.0% |
Fundamentals
| General | |
| Distribution Yield | -- |
| Dividend Yield TTM (6-8-26) | 2.52% |
| 30-Day SEC Yield (10-3-23) | 0.00% |
| 7-Day SEC Yield (10-3-23) | 0.00% |
| Number of Holdings | 37 |
| Bond | |
| Yield to Maturity (4-30-26) | 3.66% |
| Effective Duration | -- |
| Average Coupon | -- |
| Calculated Average Quality | 5.00 |
| Effective Maturity | 0.1437 |
| Nominal Maturity | 0.1437 |
| Number of Bond Holdings | 2 |
As of April 30, 2026
Fund Details
| Key Dates | |
| Inception Date | 5/30/2017 |
| Last Annual Report Date | 7/31/2025 |
| Last Prospectus Date | 9/29/2025 |
| Attributes | |
| Index Fund | -- |
| Inverse Fund | No |
| Leveraged Fund | -- |
| Fund of Funds | No |
| Currency Hedged Fund | -- |
| Socially Responsible Fund | No |
Top Portfolio Holders
| Name | % Weight |
|---|---|
| Portfolio A | 5.00% |
| Portfolio B | 3.50% |
| Portfolio C | 2.25% |
Excel Add-In Codes
| Name: =YCI("M:FYHTX", "name") |
| Broad Asset Class: =YCI("M:FYHTX", "broad_asset_class") |
| Broad Category: =YCI("M:FYHTX", "broad_category_group") |
| Prospectus Objective: =YCI("M:FYHTX", "prospectus_objective") |
| To find the codes for any of our securities and financial metrics, see our Complete Excel Reference. |