

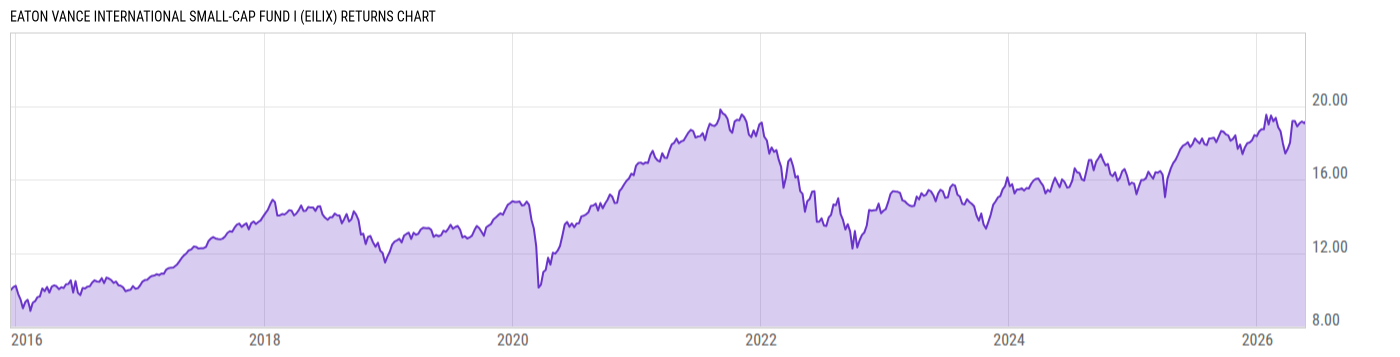
Eaton Vance International Small-Cap Fund I (EILIX)
13.59
-0.01
(-0.07%)
USD |
May 19 2026
Returns Chart
Key Stats
| Net Expense Ratio | Total Assets Under Management | Weighted Average Dividend Yield | Turnover Ratio (Generic) |
|---|---|---|---|
| 1.09% | 3.156M | 1.97% | 44.00% |
| 1 Year Fund Level Flows | 1 Year Total Returns (Daily) | Annualized Total Returns Since Inception (Daily) | Max Drawdown (Since Inception) |
| -13.95M | 8.04% |
Basic Info
| Investment Strategy | |
| The Fund seeks long-term capital appreciation. The Fund invests at least 80% of its net assets in equity securities of foreign small-cap companies. It generally considers foreign small-cap companies to be domiciled in and tied economically to one or more countries represented in the MSCI World ex-U.S. Small-Cap Index. |
| General | |
| Security Type | Mutual Fund |
| Equity Style | Mid Cap Growth |
| Broad Asset Class | International Equity |
| Broad Category | Equity |
| Global Peer Group | Equity Global ex US Sm&Mid Cap |
| Peer Group | International Small/Mid-Cap Growth |
| Global Macro | Equity Global |
| US Macro | Developed International Markets Funds |
| YCharts Categorization | -- |
| YCharts Benchmark | -- |
| Prospectus Objective | International Small-Cap Funds |
| Fund Owner Firm Name | Eaton Vance |
| Broad Asset Class Benchmark Index | |
| ^MSACXUSNTR | 100.0% |
Net Fund Flows Versus Peer Group
1 Month
% Rank:
38
-271.33M
Peer Group Low
302.64M
Peer Group High
1 Year
% Rank:
40
-13.95M
-1.684B
Peer Group Low
720.33M
Peer Group High
3 Months
% Rank:
39
-669.09M
Peer Group Low
272.17M
Peer Group High
3 Years
% Rank:
33
-2.957B
Peer Group Low
351.71M
Peer Group High
6 Months
% Rank:
32
-831.12M
Peer Group Low
249.58M
Peer Group High
5 Years
% Rank:
28
-5.166B
Peer Group Low
393.52M
Peer Group High
YTD
% Rank:
34
-741.01M
Peer Group Low
260.05M
Peer Group High
10 Years
% Rank:
38
-8.545B
Peer Group Low
1.173B
Peer Group High
Date Unavailable
Risk
Performance Versus Peer Group
Annual Total Returns Versus Peers
As of May 20, 2026.
Asset Allocation
As of February 28, 2026.
| Type | % Net |
|---|---|
| Cash | 0.22% |
| Stock | 98.55% |
| Bond | 0.04% |
| Convertible | 0.00% |
| Preferred | 0.00% |
| Other | 1.19% |
Top 10 Holdings
| Name | % Weight | Price | % Change |
|---|---|---|---|
| Fuji Corp. (Machinery) | 2.50% | 50.34 | 0.00% |
| Evolution Mining Ltd. | 2.20% | 8.12 | -6.24% |
| Diploma Plc | 1.94% | 89.11 | 0.00% |
| Babcock International Group Plc | 1.74% | 13.37 | 5.40% |
| TKMS AG & Co. KGaA | 1.70% | 90.00 | 0.00% |
| Irish Residential Properties REIT Plc | 1.67% | 1.18 | 0.00% |
| Games Workshop Group Plc | 1.65% | 267.02 | -0.37% |
| Westgold Resources Ltd. | 1.64% | 4.99 | 0.60% |
| Makita Corp. | 1.64% | 37.90 | 0.00% |
| Relo Group, Inc. | 1.63% | 11.84 | 0.00% |
Fees & Availability
| Fees | |
| Actual 12B-1 Fee | -- |
| Actual Management Fee | 0.73% |
| Administration Fee | -- |
| Maximum Front Load | -- |
| Maximum Deferred Load | -- |
| Maximum Redemption Fee | -- |
| General Availability | |
| Available for Insurance Product | No |
| Available for RRSP | No |
| Purchase Details | |
| Open to New Investors |
|
| Minimum Initial Investment | 1.00M None |
| Minimum Subsequent Investment | 0.00 None |
Basic Info
| Investment Strategy | |
| The Fund seeks long-term capital appreciation. The Fund invests at least 80% of its net assets in equity securities of foreign small-cap companies. It generally considers foreign small-cap companies to be domiciled in and tied economically to one or more countries represented in the MSCI World ex-U.S. Small-Cap Index. |
| General | |
| Security Type | Mutual Fund |
| Equity Style | Mid Cap Growth |
| Broad Asset Class | International Equity |
| Broad Category | Equity |
| Global Peer Group | Equity Global ex US Sm&Mid Cap |
| Peer Group | International Small/Mid-Cap Growth |
| Global Macro | Equity Global |
| US Macro | Developed International Markets Funds |
| YCharts Categorization | -- |
| YCharts Benchmark | -- |
| Prospectus Objective | International Small-Cap Funds |
| Fund Owner Firm Name | Eaton Vance |
| Broad Asset Class Benchmark Index | |
| ^MSACXUSNTR | 100.0% |
Fundamentals
| General | |
| Distribution Yield | -- |
| Dividend Yield TTM (5-18-26) | 8.13% |
| 30-Day SEC Yield (12-31-24) | 14.87M% |
| 7-Day SEC Yield | -- |
| Number of Holdings | 97 |
| Stock | |
| Weighted Average PE Ratio | 24.57 |
| Weighted Average Price to Sales Ratio | 5.051 |
| Weighted Average Price to Book Ratio | 4.588 |
| Weighted Median ROE | 16.87% |
| Weighted Median ROA | 8.24% |
| ROI (TTM) | 11.87% |
| Return on Investment (TTM) | 11.87% |
| Earning Yield | 0.0467 |
| LT Debt / Shareholders Equity | 0.6200 |
| Number of Equity Holdings | 92 |
As of February 28, 2026
Growth Metrics
| EPS Growth (1Y) | 19.70% |
| EPS Growth (3Y) | 13.90% |
| EPS Growth (5Y) | 13.41% |
| Sales Growth (1Y) | 10.03% |
| Sales Growth (3Y) | 10.10% |
| Sales Growth (5Y) | 10.19% |
| Sales per Share Growth (1Y) | 7.74% |
| Sales per Share Growth (3Y) | 9.01% |
| Operating Cash Flow - Growth Rate (3Y) | 25.12% |
As of February 28, 2026
Fund Details
| Key Dates | |
| Inception Date | 12/16/2015 |
| Last Annual Report Date | 11/30/2025 |
| Last Prospectus Date | 4/1/2025 |
| Share Classes | |
| EILAX | A |
| Attributes | |
| Index Fund | -- |
| Inverse Fund | No |
| Leveraged Fund | -- |
| Fund of Funds | No |
| Currency Hedged Fund | -- |
| Socially Responsible Fund | No |
Top Portfolio Holders
| Name | % Weight |
|---|---|
| Portfolio A | 5.00% |
| Portfolio B | 3.50% |
| Portfolio C | 2.25% |
Excel Add-In Codes
| Name: =YCI("M:EILIX", "name") |
| Broad Asset Class: =YCI("M:EILIX", "broad_asset_class") |
| Broad Category: =YCI("M:EILIX", "broad_category_group") |
| Prospectus Objective: =YCI("M:EILIX", "prospectus_objective") |
| To find the codes for any of our securities and financial metrics, see our Complete Excel Reference. |