

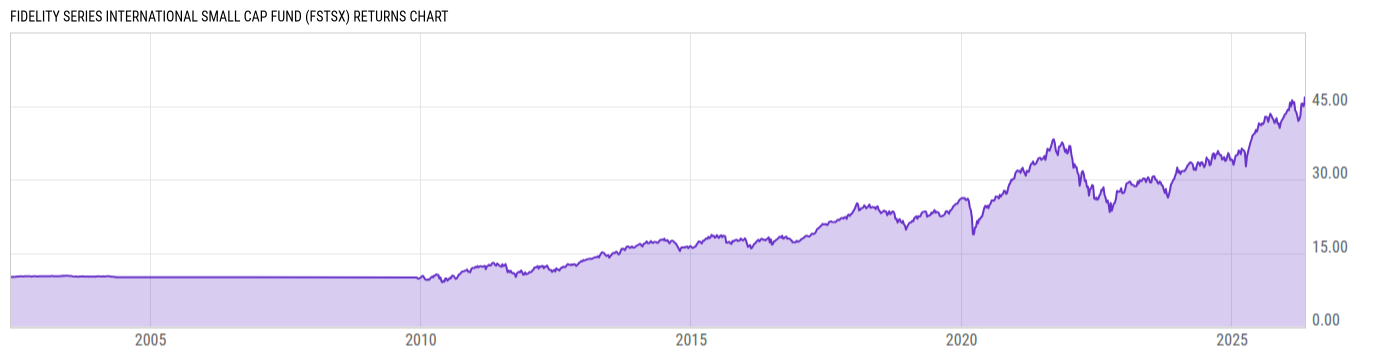
Fidelity Series International Small Cap Fund (FSTSX)
19.48
+0.07
(+0.36%)
USD |
May 29 2026
Returns Chart
Key Stats
| Net Expense Ratio | Total Assets Under Management | Weighted Average Dividend Yield | Turnover Ratio (Generic) |
|---|---|---|---|
| 0.01% | 3.299B | 1.89% | 37.00% |
| 1 Year Fund Level Flows | 1 Year Total Returns (Daily) | Annualized Total Returns Since Inception (Daily) | Max Drawdown (Since Inception) |
| -1.233B | 20.04% |
Basic Info
| Investment Strategy | |
| The Fund seeks capital appreciation. Normally investing primarily in non-U.S. securities. The Adviser considers non-U.S. securities to include investments that are tied economically to a particular country or region outside the U.S. Emerging markets include countries that have an emerging stock market as defined by MSCI. |
| General | |
| Security Type | Mutual Fund |
| Equity Style | Mid Cap Growth |
| Broad Asset Class | International Equity |
| Broad Category | Equity |
| Global Peer Group | Equity Global ex US Sm&Mid Cap |
| Peer Group | International Small/Mid-Cap Growth |
| Global Macro | Equity Global |
| US Macro | Developed International Markets Funds |
| YCharts Categorization | -- |
| YCharts Benchmark | -- |
| Prospectus Objective | International Small-Cap Funds |
| Fund Owner Firm Name | Fidelity Investments |
| Broad Asset Class Benchmark Index | |
| ^MSACXUSNTR | 100.0% |
Net Fund Flows Versus Peer Group
1 Month
% Rank:
85
-390.68M
Peer Group Low
88.67M
Peer Group High
1 Year
% Rank:
94
-1.233B
-1.684B
Peer Group Low
623.20M
Peer Group High
3 Months
% Rank:
100
-669.09M
Peer Group Low
267.69M
Peer Group High
3 Years
% Rank:
91
-3.013B
Peer Group Low
354.39M
Peer Group High
6 Months
% Rank:
100
-831.12M
Peer Group Low
275.92M
Peer Group High
5 Years
% Rank:
91
-5.218B
Peer Group Low
393.52M
Peer Group High
YTD
% Rank:
100
-741.01M
Peer Group Low
272.93M
Peer Group High
10 Years
% Rank:
90
-8.652B
Peer Group Low
938.00M
Peer Group High
Date Unavailable
Risk
Performance Versus Peer Group
Annual Total Returns Versus Peers
As of May 31, 2026.
Asset Allocation
As of February 28, 2026.
| Type | % Net |
|---|---|
| Cash | 0.66% |
| Stock | 97.08% |
| Bond | 0.72% |
| Convertible | 0.00% |
| Preferred | 0.11% |
| Other | 1.44% |
Top 10 Holdings
| Name | % Weight | Price | % Change |
|---|---|---|---|
|
Lagercrantz Group AB ORD
|
3.10% | -- | -- |
| Addtech AB | 2.78% | -- | -- |
| Games Workshop Group Plc | 2.53% | 273.50 | -0.55% |
| BE Semiconductor Industries NV | 2.48% | 333.50 | 0.00% |
| Interpump Group SpA | 2.48% | 37.25 | 0.00% |
| Aalberts NV | 2.46% | 42.68 | 0.00% |
| Howden Joinery Group Plc | 2.33% | 9.60 | 0.00% |
| Azbil Corp. | 2.30% | 9.40 | 0.00% |
|
Kbc Ancora NV ORD
|
2.21% | -- | -- |
| OR Royalties, Inc. | 1.91% | 37.01 | 3.18% |
Fees & Availability
| Fees | |
| Actual 12B-1 Fee | -- |
| Actual Management Fee | 0.00% |
| Administration Fee | -- |
| Maximum Front Load | -- |
| Maximum Deferred Load | -- |
| Maximum Redemption Fee | -- |
| General Availability | |
| Available for Insurance Product | No |
| Available for RRSP | No |
| Purchase Details | |
| Open to New Investors |
|
| Minimum Initial Investment | 0.00 None |
| Minimum Subsequent Investment | 0.00 None |
Basic Info
| Investment Strategy | |
| The Fund seeks capital appreciation. Normally investing primarily in non-U.S. securities. The Adviser considers non-U.S. securities to include investments that are tied economically to a particular country or region outside the U.S. Emerging markets include countries that have an emerging stock market as defined by MSCI. |
| General | |
| Security Type | Mutual Fund |
| Equity Style | Mid Cap Growth |
| Broad Asset Class | International Equity |
| Broad Category | Equity |
| Global Peer Group | Equity Global ex US Sm&Mid Cap |
| Peer Group | International Small/Mid-Cap Growth |
| Global Macro | Equity Global |
| US Macro | Developed International Markets Funds |
| YCharts Categorization | -- |
| YCharts Benchmark | -- |
| Prospectus Objective | International Small-Cap Funds |
| Fund Owner Firm Name | Fidelity Investments |
| Broad Asset Class Benchmark Index | |
| ^MSACXUSNTR | 100.0% |
Fundamentals
| General | |
| Distribution Yield | -- |
| Dividend Yield TTM (5-28-26) | 3.61% |
| 30-Day SEC Yield (10-3-23) | 0.00% |
| 7-Day SEC Yield (10-3-23) | 0.00% |
| Number of Holdings | 213 |
| Stock | |
| Weighted Average PE Ratio | 29.03 |
| Weighted Average Price to Sales Ratio | 5.746 |
| Weighted Average Price to Book Ratio | 5.791 |
| Weighted Median ROE | 16.89% |
| Weighted Median ROA | 9.45% |
| ROI (TTM) | 13.10% |
| Return on Investment (TTM) | 13.10% |
| Earning Yield | 0.0446 |
| LT Debt / Shareholders Equity | 0.4622 |
| Number of Equity Holdings | 200 |
As of February 28, 2026
Growth Metrics
| EPS Growth (1Y) | 13.45% |
| EPS Growth (3Y) | 9.48% |
| EPS Growth (5Y) | 15.72% |
| Sales Growth (1Y) | 8.98% |
| Sales Growth (3Y) | 10.10% |
| Sales Growth (5Y) | 11.44% |
| Sales per Share Growth (1Y) | 7.71% |
| Sales per Share Growth (3Y) | 9.22% |
| Operating Cash Flow - Growth Rate (3Y) | 17.25% |
As of February 28, 2026
Fund Details
| Key Dates | |
| Inception Date | 12/3/2009 |
| Last Annual Report Date | 10/31/2025 |
| Last Prospectus Date | 12/30/2025 |
| Attributes | |
| Index Fund | -- |
| Inverse Fund | No |
| Leveraged Fund | -- |
| Fund of Funds | No |
| Currency Hedged Fund | -- |
| Socially Responsible Fund | No |
Top Portfolio Holders
| Name | % Weight |
|---|---|
| Portfolio A | 5.00% |
| Portfolio B | 3.50% |
| Portfolio C | 2.25% |
Excel Add-In Codes
| Name: =YCI("M:FSTSX", "name") |
| Broad Asset Class: =YCI("M:FSTSX", "broad_asset_class") |
| Broad Category: =YCI("M:FSTSX", "broad_category_group") |
| Prospectus Objective: =YCI("M:FSTSX", "prospectus_objective") |
| To find the codes for any of our securities and financial metrics, see our Complete Excel Reference. |