

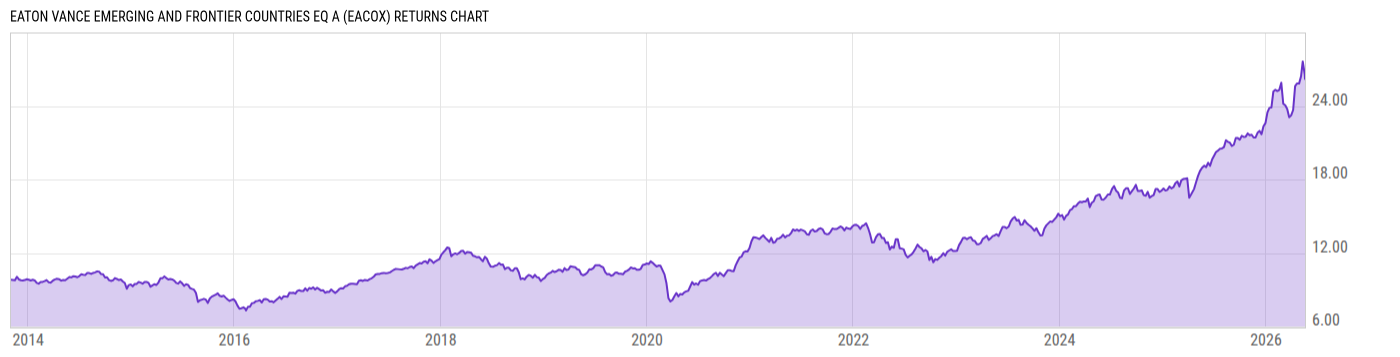
Eaton Vance Emerging and Frontier Countries Eq A (EACOX)
21.85
+0.24
(+1.11%)
USD |
Jun 09 2026
Returns Chart
Key Stats
| Net Expense Ratio | Total Assets Under Management | Weighted Average Dividend Yield | Turnover Ratio (Generic) |
|---|---|---|---|
| 1.40% | 4.141B | 2.16% | 54.00% |
| 1 Year Fund Level Flows | 1 Year Total Returns (Daily) | Annualized Total Returns Since Inception (Daily) | Max Drawdown (Since Inception) |
| 1.179B | 41.07% |
Basic Info
| Investment Strategy | |
| The Fund seeks total return. Under normal market conditions, the Fund invests at least 40% of its net assets in equity-related securities that are tied economically to a number of countries throughout the world. Equity-related securities are defined as common or preferred stocks of companies of any market capitalization. |
| General | |
| Security Type | Mutual Fund |
| Equity Style | Multi Cap Core |
| Broad Asset Class | International Equity |
| Broad Category | Equity |
| Global Peer Group | Equity Frontier Markets |
| Peer Group | Frontier Markets Funds |
| Global Macro | Equity Emerging Markets |
| US Macro | Emerging Markets Equity Funds |
| YCharts Categorization | -- |
| YCharts Benchmark | -- |
| Prospectus Objective | Frontier Markets Funds |
| Fund Owner Firm Name | Eaton Vance |
| Broad Asset Class Benchmark Index | |
| ^MSACXUSNTR | 100.0% |
Net Fund Flows Versus Peer Group
1 Month
% Rank:
11
-1.736M
Peer Group Low
79.60M
Peer Group High
1 Year
% Rank:
11
1.179B
-29.40M
Peer Group Low
1.179B
Peer Group High
3 Months
% Rank:
11
-60.58M
Peer Group Low
212.84M
Peer Group High
3 Years
% Rank:
11
-141.32M
Peer Group Low
2.442B
Peer Group High
6 Months
% Rank:
11
-19.74M
Peer Group Low
611.17M
Peer Group High
5 Years
% Rank:
11
-146.02M
Peer Group Low
2.504B
Peer Group High
YTD
% Rank:
11
-24.54M
Peer Group Low
524.09M
Peer Group High
10 Years
% Rank:
11
-822.26M
Peer Group Low
2.500B
Peer Group High
Date Unavailable
Risk
Performance Versus Peer Group
Annual Total Returns Versus Peers
As of June 10, 2026.
Asset Allocation
As of February 28, 2026.
| Type | % Net |
|---|---|
| Cash | 4.67% |
| Stock | 91.34% |
| Bond | 3.11% |
| Convertible | 0.00% |
| Preferred | 2.17% |
| Other | -1.29% |
Top 10 Holdings
| Name | % Weight | Price | % Change |
|---|---|---|---|
| Samsung Electronics Co., Ltd. | 6.75% | 140.00 | 0.00% |
| Morgan Stanley Inst Liq Govt Port Institutional | 5.30% | 1.00 | 0.00% |
| Taiwan Semiconductor Manufacturing Co., Ltd. | 4.82% | 17.24 | 0.00% |
|
SK Hynix Inc ORD
|
3.44% | -- | -- |
| Bank of Cyprus Holdings Plc | 2.26% | 11.88 | 0.00% |
| OTP Bank Nyrt | 1.46% | 135.76 | 0.00% |
| National Bank of Greece SA | 1.38% | 17.63 | 4.96% |
|
NOVA LJUBLJANSKA BANKA D.D.LJUBLJANA GDR
|
1.37% | -- | -- |
|
Vingroup JSC ORD
|
1.32% | -- | -- |
| Eurobank SA | 1.25% | 4.19 | 0.00% |
Fees & Availability
| Fees | |
| Actual 12B-1 Fee | 0.25% |
| Actual Management Fee | 0.87% |
| Administration Fee | -- |
| Maximum Front Load | 5.25% |
| Maximum Deferred Load | -- |
| Maximum Redemption Fee | -- |
| General Availability | |
| Available for Insurance Product | No |
| Available for RRSP | No |
| Purchase Details | |
| Open to New Investors |
|
| Minimum Initial Investment | 1000.00 None |
| Minimum Subsequent Investment | 0.00 None |
Basic Info
| Investment Strategy | |
| The Fund seeks total return. Under normal market conditions, the Fund invests at least 40% of its net assets in equity-related securities that are tied economically to a number of countries throughout the world. Equity-related securities are defined as common or preferred stocks of companies of any market capitalization. |
| General | |
| Security Type | Mutual Fund |
| Equity Style | Multi Cap Core |
| Broad Asset Class | International Equity |
| Broad Category | Equity |
| Global Peer Group | Equity Frontier Markets |
| Peer Group | Frontier Markets Funds |
| Global Macro | Equity Emerging Markets |
| US Macro | Emerging Markets Equity Funds |
| YCharts Categorization | -- |
| YCharts Benchmark | -- |
| Prospectus Objective | Frontier Markets Funds |
| Fund Owner Firm Name | Eaton Vance |
| Broad Asset Class Benchmark Index | |
| ^MSACXUSNTR | 100.0% |
Fundamentals
| General | |
| Distribution Yield | -- |
| Dividend Yield TTM (6-8-26) | 2.03% |
| 30-Day SEC Yield (12-31-24) | 22.62M% |
| 7-Day SEC Yield | -- |
| Number of Holdings | 589 |
| Stock | |
| Weighted Average PE Ratio | 21.64 |
| Weighted Average Price to Sales Ratio | 4.510 |
| Weighted Average Price to Book Ratio | 3.869 |
| Weighted Median ROE | 25.37% |
| Weighted Median ROA | 8.63% |
| ROI (TTM) | 17.51% |
| Return on Investment (TTM) | 17.51% |
| Earning Yield | 0.0716 |
| LT Debt / Shareholders Equity | 0.5397 |
| Number of Equity Holdings | 538 |
As of February 28, 2026
Growth Metrics
| EPS Growth (1Y) | 30.67% |
| EPS Growth (3Y) | 23.64% |
| EPS Growth (5Y) | 22.52% |
| Sales Growth (1Y) | 19.88% |
| Sales Growth (3Y) | 17.94% |
| Sales Growth (5Y) | 16.46% |
| Sales per Share Growth (1Y) | 25.76% |
| Sales per Share Growth (3Y) | 32.24% |
| Operating Cash Flow - Growth Rate (3Y) | 20.47% |
As of February 28, 2026
Fund Details
| Key Dates | |
| Inception Date | 11/1/2013 |
| Last Annual Report Date | 10/31/2025 |
| Last Prospectus Date | 3/1/2026 |
| Share Classes | |
| EICOX | Inst |
| Attributes | |
| Index Fund | -- |
| Inverse Fund | No |
| Leveraged Fund | -- |
| Fund of Funds | No |
| Currency Hedged Fund | -- |
| Socially Responsible Fund | No |
Top Portfolio Holders
| Name | % Weight |
|---|---|
| Portfolio A | 5.00% |
| Portfolio B | 3.50% |
| Portfolio C | 2.25% |
Excel Add-In Codes
| Name: =YCI("M:EACOX", "name") |
| Broad Asset Class: =YCI("M:EACOX", "broad_asset_class") |
| Broad Category: =YCI("M:EACOX", "broad_category_group") |
| Prospectus Objective: =YCI("M:EACOX", "prospectus_objective") |
| To find the codes for any of our securities and financial metrics, see our Complete Excel Reference. |