

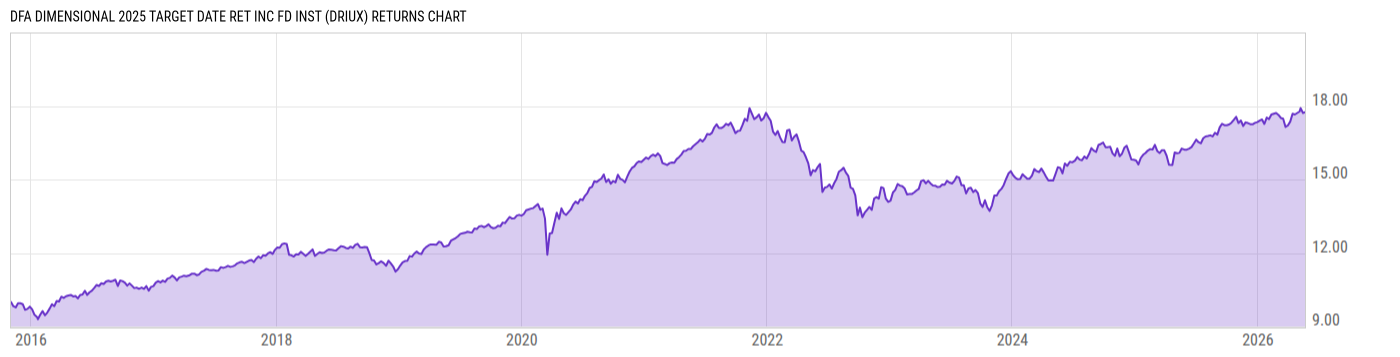
DFA Dimensional 2025 Target Date Ret Inc Fd Inst (DRIUX)
11.58
+0.03
(+0.26%)
USD |
Jun 09 2026
Returns Chart
Key Stats
| Net Expense Ratio | Total Assets Under Management | Weighted Average Dividend Yield | Turnover Ratio (Generic) |
|---|---|---|---|
| 0.16% | 108.84M | -- | 15.00% |
| 1 Year Fund Level Flows | 1 Year Total Returns (Daily) | Annualized Total Returns Since Inception (Daily) | Max Drawdown (Since Inception) |
| -26.58M | 9.80% |
Basic Info
| Investment Strategy | |
| The Fund seeks to provide total return consistent with the Portfolio's current asset allocation. The Fund allocates its assets to other mutual funds managed by the Advisor (i.e., the Underlying Funds) according to an asset allocation strategy designed for investors planning to retire in or within a few years of 2025. |
| General | |
| Security Type | Mutual Fund |
| Equity Style | -- |
| Broad Asset Class | Allocation |
| Broad Category | Allocation |
| Global Peer Group | Target Maturity MA USD 2025 |
| Peer Group | Mixed-Asset Target 2025 Funds |
| Global Macro | Target Maturity |
| US Macro | Mixed-Assets Target Date Funds |
| YCharts Categorization | -- |
| YCharts Benchmark | -- |
| Prospectus Objective | Growth & Income Funds |
| Fund Owner Firm Name | Dimensional |
| Broad Asset Class Benchmark Index | |
| ^SPXTR | 100.0% |
Net Fund Flows Versus Peer Group
1 Month
% Rank:
29
-1.102B
Peer Group Low
129.23M
Peer Group High
1 Year
% Rank:
35
-26.58M
-9.196B
Peer Group Low
486.89M
Peer Group High
3 Months
% Rank:
28
-2.501B
Peer Group Low
168.36M
Peer Group High
3 Years
% Rank:
44
-24.95B
Peer Group Low
975.77M
Peer Group High
6 Months
% Rank:
35
-4.802B
Peer Group Low
335.21M
Peer Group High
5 Years
% Rank:
36
-40.09B
Peer Group Low
1.084B
Peer Group High
YTD
% Rank:
35
-4.274B
Peer Group Low
282.43M
Peer Group High
10 Years
% Rank:
63
-46.59B
Peer Group Low
6.980B
Peer Group High
Date Unavailable
Risk
Performance Versus Peer Group
Annual Total Returns Versus Peers
As of June 10, 2026.
Asset Allocation
As of February 28, 2026.
| Type | % Net |
|---|---|
| Cash | 0.49% |
| Stock | 24.53% |
| Bond | 74.61% |
| Convertible | 0.00% |
| Preferred | 0.04% |
| Other | 0.34% |
Top 9 Holdings
| Name | % Weight | Price | % Change |
|---|---|---|---|
| DFA Inflation Protected Securities Portfolio Inst | 56.92% | 11.24 | 0.18% |
| DFA LTIP Portfolio Institutional | 18.22% | 5.12 | 0.79% |
| DFA US Large Company Portfolio Inst | 8.59% | 49.08 | -0.30% |
| DFA US Core Equity 1 Portfolio Institutional | 8.58% | 54.43 | 0.04% |
| DFA Large Cap International Portfolio Inst | 3.43% | 37.50 | -0.03% |
| DFA Emerging Markets Core Equity 2 Portfolio Inst | 2.48% | 34.27 | 1.03% |
| DFA International Core Equity 2 Portfolio Inst | 1.72% | 21.96 | -0.14% |
|
Other Assets less Liabilities
|
0.06% | -- | -- |
|
USD Cash
|
0.00% | -- | -- |
Fees & Availability
| Fees | |
| Actual 12B-1 Fee | -- |
| Actual Management Fee | 0.00% |
| Administration Fee | -- |
| Maximum Front Load | -- |
| Maximum Deferred Load | -- |
| Maximum Redemption Fee | -- |
| General Availability | |
| Available for Insurance Product | No |
| Available for RRSP | No |
| Purchase Details | |
| Open to New Investors |
|
| Minimum Initial Investment | 0.00 None |
| Minimum Subsequent Investment | 0.00 None |
Basic Info
| Investment Strategy | |
| The Fund seeks to provide total return consistent with the Portfolio's current asset allocation. The Fund allocates its assets to other mutual funds managed by the Advisor (i.e., the Underlying Funds) according to an asset allocation strategy designed for investors planning to retire in or within a few years of 2025. |
| General | |
| Security Type | Mutual Fund |
| Equity Style | -- |
| Broad Asset Class | Allocation |
| Broad Category | Allocation |
| Global Peer Group | Target Maturity MA USD 2025 |
| Peer Group | Mixed-Asset Target 2025 Funds |
| Global Macro | Target Maturity |
| US Macro | Mixed-Assets Target Date Funds |
| YCharts Categorization | -- |
| YCharts Benchmark | -- |
| Prospectus Objective | Growth & Income Funds |
| Fund Owner Firm Name | Dimensional |
| Broad Asset Class Benchmark Index | |
| ^SPXTR | 100.0% |
Fundamentals
| General | |
| Distribution Yield | -- |
| Dividend Yield TTM (6-8-26) | 3.18% |
| 30-Day SEC Yield | -- |
| 7-Day SEC Yield | -- |
| Number of Holdings | 9 |
| Stock | |
| Weighted Average PE Ratio | 29.57 |
| Weighted Average Price to Sales Ratio | 6.792 |
| Weighted Average Price to Book Ratio | 8.629 |
| Weighted Median ROE | 53.48% |
| Weighted Median ROA | 13.55% |
| ROI (TTM) | 21.44% |
| Return on Investment (TTM) | 21.44% |
| Earning Yield | 55.84 |
| LT Debt / Shareholders Equity | 0.9009 |
| Number of Equity Holdings | 0 |
| Bond | |
| Yield to Maturity (2-28-26) | 1.77% |
| Effective Duration | 10.65 |
| Average Coupon | 1.40% |
| Calculated Average Quality | 2.00 |
| Effective Maturity | 11.65 |
| Nominal Maturity | 11.65 |
| Number of Bond Holdings | 0 |
As of February 28, 2026
Growth Metrics
| EPS Growth (1Y) | 25.84% |
| EPS Growth (3Y) | 15.48% |
| EPS Growth (5Y) | 20.57% |
| Sales Growth (1Y) | 13.69% |
| Sales Growth (3Y) | 11.38% |
| Sales Growth (5Y) | 13.10% |
| Sales per Share Growth (1Y) | 18.05% |
| Sales per Share Growth (3Y) | 12.09% |
| Operating Cash Flow - Growth Rate (3Y) | 16.80% |
As of February 28, 2026
Fund Details
| Key Dates | |
| Inception Date | 11/2/2015 |
| Last Annual Report Date | 10/31/2025 |
| Last Prospectus Date | 2/28/2026 |
| Attributes | |
| Index Fund | -- |
| Inverse Fund | No |
| Leveraged Fund | -- |
| Fund of Funds |
|
| Currency Hedged Fund | -- |
| Socially Responsible Fund | No |
Top Portfolio Holders
| Name | % Weight |
|---|---|
| Portfolio A | 5.00% |
| Portfolio B | 3.50% |
| Portfolio C | 2.25% |
Excel Add-In Codes
| Name: =YCI("M:DRIUX", "name") |
| Broad Asset Class: =YCI("M:DRIUX", "broad_asset_class") |
| Broad Category: =YCI("M:DRIUX", "broad_category_group") |
| Prospectus Objective: =YCI("M:DRIUX", "prospectus_objective") |
| To find the codes for any of our securities and financial metrics, see our Complete Excel Reference. |