

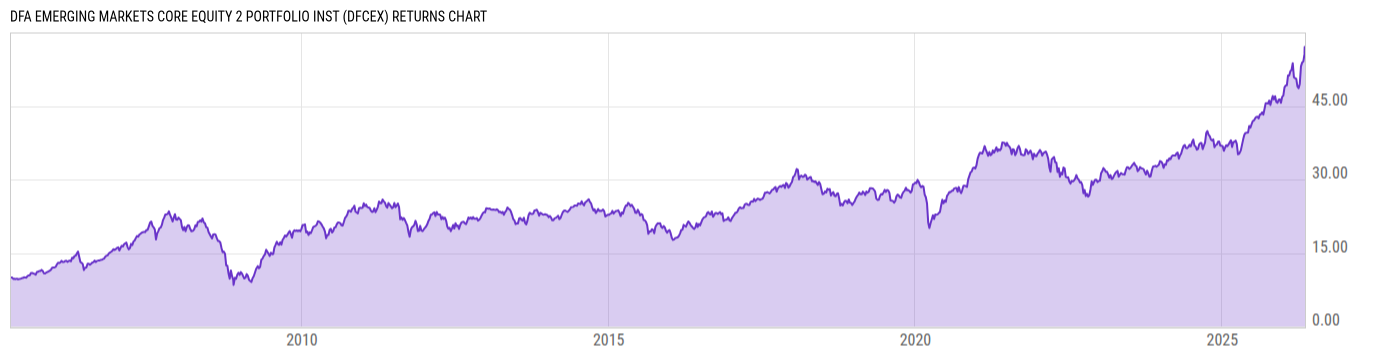
DFA Emerging Markets Core Equity 2 Portfolio Inst (DFCEX)
36.06
+0.68
(+1.92%)
USD |
Jun 01 2026
Returns Chart
Key Stats
| Net Expense Ratio | Total Assets Under Management | Weighted Average Dividend Yield | Turnover Ratio (Generic) |
|---|---|---|---|
| 0.39% | 40.31B | 2.29% | 5.00% |
| 1 Year Fund Level Flows | 1 Year Total Returns (Daily) | Annualized Total Returns Since Inception (Daily) | Max Drawdown (Since Inception) |
| -1.900B | 49.29% |
Basic Info
| Investment Strategy | |
| The Fund seeks to achieve long-term capital appreciation. Under normal circumstances, the Fund will invest at least 80% of its net assets in a broad and diverse group of equity securities associated with emerging markets, which may include frontier markets authorized for investment by the Advisors Investment Committee. |
| General | |
| Security Type | Mutual Fund |
| Equity Style | Multi Cap Value |
| Broad Asset Class | International Equity |
| Broad Category | Equity |
| Global Peer Group | Equity Emerging Markets Global |
| Peer Group | Emerging Markets Funds |
| Global Macro | Equity Emerging Markets |
| US Macro | Emerging Markets Equity Funds |
| YCharts Categorization | -- |
| YCharts Benchmark | -- |
| Prospectus Objective | Emerging Markets Funds |
| Fund Owner Firm Name | Dimensional |
| Broad Asset Class Benchmark Index | |
| ^MSACXUSNTR | 100.0% |
Net Fund Flows Versus Peer Group
1 Month
% Rank:
100
-1.331B
Peer Group Low
3.871B
Peer Group High
1 Year
% Rank:
98
-1.900B
-8.933B
Peer Group Low
23.49B
Peer Group High
3 Months
% Rank:
99
-2.275B
Peer Group Low
3.532B
Peer Group High
3 Years
% Rank:
99
-20.46B
Peer Group Low
24.84B
Peer Group High
6 Months
% Rank:
98
-2.671B
Peer Group Low
11.45B
Peer Group High
5 Years
% Rank:
99
-33.39B
Peer Group Low
31.60B
Peer Group High
YTD
% Rank:
98
-1.969B
Peer Group Low
11.15B
Peer Group High
10 Years
% Rank:
96
-33.46B
Peer Group Low
77.97B
Peer Group High
Date Unavailable
Risk
Performance Versus Peer Group
Annual Total Returns Versus Peers
As of June 02, 2026.
Asset Allocation
As of January 31, 2026.
| Type | % Net |
|---|---|
| Cash | 0.99% |
| Stock | 98.64% |
| Bond | 0.00% |
| Convertible | 0.00% |
| Preferred | 0.90% |
| Other | -0.54% |
Top 10 Holdings
| Name | % Weight | Price | % Change |
|---|---|---|---|
| Taiwan Semiconductor Manufacturing Co., Ltd. | 6.17% | 17.24 | 0.00% |
| Samsung Electronics Co., Ltd. | 3.31% | 140.00 | 0.00% |
| Tencent Holdings Ltd. | 2.42% | 55.41 | 1.26% |
| Taiwan Semiconductor Manufacturing Co., Ltd. | 2.12% | 446.08 | 2.40% |
|
SK Hynix Inc ORD
|
1.73% | -- | -- |
|
DFA Investment Trust Company
|
1.54% | -- | -- |
| Alibaba Group Holding Ltd. | 1.40% | 15.00 | -6.25% |
|
EMINI S&P MAR26
|
0.81% | -- | -- |
|
USD Cash
|
0.69% | -- | -- |
| Ping An Insurance (Group) Co. of China Ltd. | 0.60% | 8.10 | 6.16% |
Fees & Availability
| Fees | |
| Actual 12B-1 Fee | -- |
| Actual Management Fee | 0.33% |
| Administration Fee | -- |
| Maximum Front Load | -- |
| Maximum Deferred Load | -- |
| Maximum Redemption Fee | -- |
| General Availability | |
| Available for Insurance Product | No |
| Available for RRSP | No |
| Purchase Details | |
| Open to New Investors |
|
| Minimum Initial Investment | 0.00 None |
| Minimum Subsequent Investment | 0.00 None |
Basic Info
| Investment Strategy | |
| The Fund seeks to achieve long-term capital appreciation. Under normal circumstances, the Fund will invest at least 80% of its net assets in a broad and diverse group of equity securities associated with emerging markets, which may include frontier markets authorized for investment by the Advisors Investment Committee. |
| General | |
| Security Type | Mutual Fund |
| Equity Style | Multi Cap Value |
| Broad Asset Class | International Equity |
| Broad Category | Equity |
| Global Peer Group | Equity Emerging Markets Global |
| Peer Group | Emerging Markets Funds |
| Global Macro | Equity Emerging Markets |
| US Macro | Emerging Markets Equity Funds |
| YCharts Categorization | -- |
| YCharts Benchmark | -- |
| Prospectus Objective | Emerging Markets Funds |
| Fund Owner Firm Name | Dimensional |
| Broad Asset Class Benchmark Index | |
| ^MSACXUSNTR | 100.0% |
Fundamentals
| General | |
| Distribution Yield | -- |
| Dividend Yield TTM (5-29-26) | 2.37% |
| 30-Day SEC Yield | -- |
| 7-Day SEC Yield | -- |
| Number of Holdings | 7704 |
| Stock | |
| Weighted Average PE Ratio | 23.41 |
| Weighted Average Price to Sales Ratio | 4.640 |
| Weighted Average Price to Book Ratio | 4.092 |
| Weighted Median ROE | 17.02% |
| Weighted Median ROA | 8.27% |
| ROI (TTM) | 13.55% |
| Return on Investment (TTM) | 13.55% |
| Earning Yield | 558.48 |
| LT Debt / Shareholders Equity | 0.4414 |
| Number of Equity Holdings | 7644 |
As of January 31, 2026
Growth Metrics
| EPS Growth (1Y) | 27.33% |
| EPS Growth (3Y) | 12.34% |
| EPS Growth (5Y) | 17.77% |
| Sales Growth (1Y) | 12.45% |
| Sales Growth (3Y) | 11.03% |
| Sales Growth (5Y) | 12.61% |
| Sales per Share Growth (1Y) | 14.44% |
| Sales per Share Growth (3Y) | 10.69% |
| Operating Cash Flow - Growth Rate (3Y) | 18.13% |
As of January 31, 2026
Fund Details
| Key Dates | |
| Inception Date | 4/5/2005 |
| Last Annual Report Date | 10/31/2025 |
| Last Prospectus Date | 2/28/2025 |
| Attributes | |
| Index Fund | -- |
| Inverse Fund | No |
| Leveraged Fund | -- |
| Fund of Funds | No |
| Currency Hedged Fund | -- |
| Socially Responsible Fund | No |
Top Portfolio Holders
| Name | % Weight |
|---|---|
| Portfolio A | 5.00% |
| Portfolio B | 3.50% |
| Portfolio C | 2.25% |
Excel Add-In Codes
| Name: =YCI("M:DFCEX", "name") |
| Broad Asset Class: =YCI("M:DFCEX", "broad_asset_class") |
| Broad Category: =YCI("M:DFCEX", "broad_category_group") |
| Prospectus Objective: =YCI("M:DFCEX", "prospectus_objective") |
| To find the codes for any of our securities and financial metrics, see our Complete Excel Reference. |