

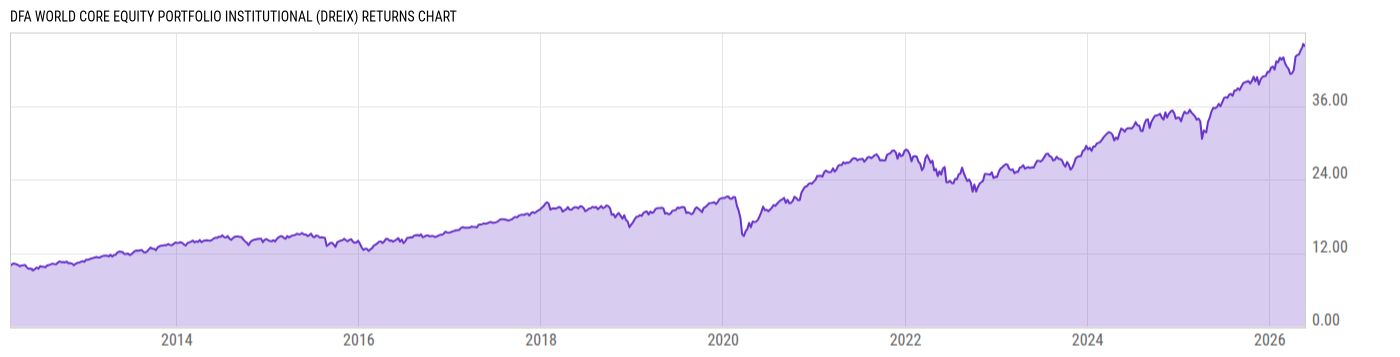
DFA World Core Equity Portfolio Institutional (DREIX)
31.15
+0.11
(+0.35%)
USD |
May 22 2026
Returns Chart
Key Stats
| Net Expense Ratio | Total Assets Under Management | Weighted Average Dividend Yield | Turnover Ratio (Generic) |
|---|---|---|---|
| 0.27% | 1.313B | -- | 8.00% |
| 1 Year Fund Level Flows | 1 Year Total Returns (Daily) | Annualized Total Returns Since Inception (Daily) | Max Drawdown (Since Inception) |
| -181.83M | 30.64% |
Basic Info
| Investment Strategy | |
| The Fund seeks long-term capital appreciation. The Fund invests its assets in the following manner; 50 to 80% in the US Core Equity I Portfolio and US Large Company Portfolio; 15 to 45% in the International Core Equity Portfolio and Large Cap International Portfolio and the rest in Emerging Markets. |
| General | |
| Security Type | Mutual Fund |
| Equity Style | -- |
| Broad Asset Class | International Equity |
| Broad Category | Equity |
| Global Peer Group | Equity Global |
| Peer Group | Global Large-Cap Core |
| Global Macro | Equity Global |
| US Macro | Developed Global Markets Funds |
| YCharts Categorization | -- |
| YCharts Benchmark | -- |
| Prospectus Objective | Global Funds |
| Fund Owner Firm Name | Dimensional |
| Broad Asset Class Benchmark Index | |
| ^MSACXUSNTR | 100.0% |
Net Fund Flows Versus Peer Group
1 Month
% Rank:
25
-876.05M
Peer Group Low
1.208B
Peer Group High
1 Year
% Rank:
72
-181.83M
-12.09B
Peer Group Low
4.555B
Peer Group High
3 Months
% Rank:
57
-1.617B
Peer Group Low
3.160B
Peer Group High
3 Years
% Rank:
66
-27.55B
Peer Group Low
11.42B
Peer Group High
6 Months
% Rank:
60
-6.572B
Peer Group Low
5.439B
Peer Group High
5 Years
% Rank:
63
-34.94B
Peer Group Low
11.42B
Peer Group High
YTD
% Rank:
56
-3.217B
Peer Group Low
4.147B
Peer Group High
10 Years
% Rank:
38
-53.63B
Peer Group Low
13.11B
Peer Group High
Date Unavailable
Risk
Performance Versus Peer Group
Annual Total Returns Versus Peers
As of May 24, 2026.
Asset Allocation
As of February 28, 2026.
| Type | % Net |
|---|---|
| Cash | 1.07% |
| Stock | 98.33% |
| Bond | 0.37% |
| Convertible | 0.00% |
| Preferred | 0.20% |
| Other | 0.02% |
Top 6 Holdings
| Name | % Weight | Price | % Change |
|---|---|---|---|
| DFA US Core Equity 1 Portfolio Institutional | 60.20% | 54.61 | 0.52% |
| DFA International Core Equity 2 Portfolio Inst | 26.93% | 22.27 | -0.09% |
| DFA Emerging Markets Core Equity 2 Portfolio Inst | 12.86% | 34.43 | 0.44% |
| State Street US Government Money Market Fund Prem | 0.01% | 1.00 | 0.00% |
|
USD Cash
|
0.00% | -- | -- |
|
Other Assets less Liabilities
|
-0.01% | -- | -- |
Fees & Availability
| Fees | |
| Actual 12B-1 Fee | -- |
| Actual Management Fee | 0.05% |
| Administration Fee | -- |
| Maximum Front Load | -- |
| Maximum Deferred Load | -- |
| Maximum Redemption Fee | -- |
| General Availability | |
| Available for Insurance Product | No |
| Available for RRSP | No |
| Purchase Details | |
| Open to New Investors |
|
| Minimum Initial Investment | 0.00 None |
| Minimum Subsequent Investment | 0.00 None |
Basic Info
| Investment Strategy | |
| The Fund seeks long-term capital appreciation. The Fund invests its assets in the following manner; 50 to 80% in the US Core Equity I Portfolio and US Large Company Portfolio; 15 to 45% in the International Core Equity Portfolio and Large Cap International Portfolio and the rest in Emerging Markets. |
| General | |
| Security Type | Mutual Fund |
| Equity Style | -- |
| Broad Asset Class | International Equity |
| Broad Category | Equity |
| Global Peer Group | Equity Global |
| Peer Group | Global Large-Cap Core |
| Global Macro | Equity Global |
| US Macro | Developed Global Markets Funds |
| YCharts Categorization | -- |
| YCharts Benchmark | -- |
| Prospectus Objective | Global Funds |
| Fund Owner Firm Name | Dimensional |
| Broad Asset Class Benchmark Index | |
| ^MSACXUSNTR | 100.0% |
Fundamentals
| General | |
| Distribution Yield | -- |
| Dividend Yield TTM (5-21-26) | 1.63% |
| 30-Day SEC Yield | -- |
| 7-Day SEC Yield | -- |
| Number of Holdings | 6 |
| Stock | |
| Weighted Average PE Ratio | 27.83 |
| Weighted Average Price to Sales Ratio | 5.798 |
| Weighted Average Price to Book Ratio | 7.433 |
| Weighted Median ROE | 45.50% |
| Weighted Median ROA | 11.75% |
| ROI (TTM) | 19.06% |
| Return on Investment (TTM) | 19.06% |
| Earning Yield | 71.87 |
| LT Debt / Shareholders Equity | 0.9007 |
| Number of Equity Holdings | 0 |
As of February 28, 2026
Growth Metrics
| EPS Growth (1Y) | 24.05% |
| EPS Growth (3Y) | 14.25% |
| EPS Growth (5Y) | 19.00% |
| Sales Growth (1Y) | 12.29% |
| Sales Growth (3Y) | 10.52% |
| Sales Growth (5Y) | 12.00% |
| Sales per Share Growth (1Y) | 17.44% |
| Sales per Share Growth (3Y) | 11.25% |
| Operating Cash Flow - Growth Rate (3Y) | 16.46% |
As of February 28, 2026
Fund Details
| Key Dates | |
| Inception Date | 3/7/2012 |
| Last Annual Report Date | 10/31/2025 |
| Last Prospectus Date | 2/28/2026 |
| Attributes | |
| Index Fund | -- |
| Inverse Fund | No |
| Leveraged Fund | -- |
| Fund of Funds |
|
| Currency Hedged Fund | -- |
| Socially Responsible Fund | No |
Top Portfolio Holders
| Name | % Weight |
|---|---|
| Portfolio A | 5.00% |
| Portfolio B | 3.50% |
| Portfolio C | 2.25% |
Excel Add-In Codes
| Name: =YCI("M:DREIX", "name") |
| Broad Asset Class: =YCI("M:DREIX", "broad_asset_class") |
| Broad Category: =YCI("M:DREIX", "broad_category_group") |
| Prospectus Objective: =YCI("M:DREIX", "prospectus_objective") |
| To find the codes for any of our securities and financial metrics, see our Complete Excel Reference. |