

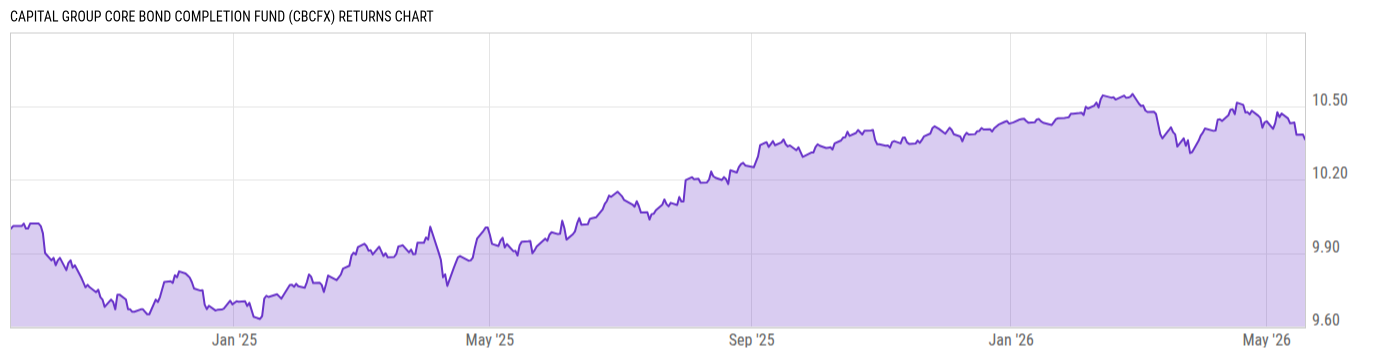
Capital Group Core Bond Completion Fund (CBCFX)
9.62
+0.01
(+0.10%)
USD |
Jun 09 2026
Returns Chart
Key Stats
| Net Expense Ratio | Total Assets Under Management | Weighted Average Dividend Yield | Turnover Ratio (Generic) |
|---|---|---|---|
| 0.00% | 37.79M | -- | 453.0% |
| 1 Year Fund Level Flows | 1 Year Total Returns (Daily) | Annualized Total Returns Since Inception (Daily) | Max Drawdown (Since Inception) |
| 8.239M | 4.51% |
Basic Info
| Investment Strategy | |
| The Fund seeks to provide as high a level of current income and the preservation of capital. The primarily invest in bonds and other debt securities, which may be represented by derivatives. Adviser is to seek to invest in attractively priced securities that, in its opinion long-term investment opportunities. |
| General | |
| Security Type | Mutual Fund |
| Equity Style | -- |
| Broad Asset Class | Taxable Bond |
| Broad Category | Fixed Income |
| Global Peer Group | Bond USD |
| Peer Group | General Bond Funds |
| Global Macro | Bond HC |
| US Macro | General Domestic Taxable Fixed Income Funds |
| YCharts Categorization | -- |
| YCharts Benchmark | -- |
| Prospectus Objective | General Bond Funds |
| Fund Owner Firm Name | Capital Group |
| Broad Asset Class Benchmark Index | |
| ^BBUSATR | 100.0% |
Net Fund Flows Versus Peer Group
1 Month
% Rank:
47
-3.511B
Peer Group Low
3.098B
Peer Group High
1 Year
% Rank:
49
8.239M
-647.01M
Peer Group Low
13.23B
Peer Group High
3 Months
% Rank:
38
-2.241B
Peer Group Low
3.962B
Peer Group High
3 Years
% Rank:
46
-12.70B
Peer Group Low
18.00B
Peer Group High
6 Months
% Rank:
40
-3.515B
Peer Group Low
5.649B
Peer Group High
5 Years
% Rank:
58
-1.461B
Peer Group Low
49.86B
Peer Group High
YTD
% Rank:
38
-2.086B
Peer Group Low
5.100B
Peer Group High
10 Years
% Rank:
64
-1.866B
Peer Group Low
81.23B
Peer Group High
Date Unavailable
Risk
Performance Versus Peer Group
Annual Total Returns Versus Peers
As of June 11, 2026.
Asset Allocation
As of March 31, 2026.
| Type | % Net |
|---|---|
| Cash | 0.25% |
| Stock | 0.00% |
| Bond | 98.56% |
| Convertible | 0.00% |
| Preferred | 0.00% |
| Other | 1.19% |
Top 10 Holdings
| Name | % Weight | Price | % Change |
|---|---|---|---|
| PACIFIC GAS AND ELECTRIC COMPANY PCG-PacGas+Elec 2.5 02/01/2031 FIX USD Corporate | 2.33% | 89.37 | 0.02% |
| FORD MOTOR CREDIT COMPANY LLC F-MotCrLLC 6.798 11/07/2028 FIX USD Corporate | 1.96% | 103.42 | 0.00% |
| Eagle Funding LuxCo S.a r.l. EAGLEFU 5.5 08/17/2030 FIX USD Corporate 144A | 1.74% | 100.06 | -0.17% |
| Morgan Stanley MWD 4.654 10/18/2030 FLT USD Corporate '29 | 1.60% | 99.28 | 0.01% |
|
IMPRINT PAYMENTS CREDIT CARD MASTER TRUST 2025 A CAM FIX 4.84% 15-SEP-2029
|
1.56% | -- | -- |
| Wells Fargo & Company WFC 5.574 07/25/2029 FLT USD Corporate '28 | 1.54% | 101.70 | 0.02% |
| UBS Group AG UBSGRO 5.617 09/13/2030 FLT USD Corporate 144A '29 | 1.47% | 102.14 | 0.00% |
| The Goldman Sachs Group, Inc. GS 5.727 04/25/2030 FLT USD Corporate '29 | 1.42% | 102.38 | 0.01% |
| Deutsche Bank AG, New York Branch DEUTBACA 4.999 09/11/2030 FLT USD Corporate '29 | 1.38% | 100.10 | -0.08% |
| JPMorgan Chase & Co. JPM 5.581 04/22/2030 FLT USD Corporate '29 | 1.35% | 102.14 | -0.06% |
Fees & Availability
| Fees | |
| Actual 12B-1 Fee | -- |
| Actual Management Fee | 0.00% |
| Administration Fee | -- |
| Maximum Front Load | -- |
| Maximum Deferred Load | -- |
| Maximum Redemption Fee | -- |
| General Availability | |
| Available for Insurance Product | No |
| Available for RRSP | No |
| Purchase Details | |
| Open to New Investors |
|
| Minimum Initial Investment | 0.00 None |
| Minimum Subsequent Investment | 0.00 None |
Basic Info
| Investment Strategy | |
| The Fund seeks to provide as high a level of current income and the preservation of capital. The primarily invest in bonds and other debt securities, which may be represented by derivatives. Adviser is to seek to invest in attractively priced securities that, in its opinion long-term investment opportunities. |
| General | |
| Security Type | Mutual Fund |
| Equity Style | -- |
| Broad Asset Class | Taxable Bond |
| Broad Category | Fixed Income |
| Global Peer Group | Bond USD |
| Peer Group | General Bond Funds |
| Global Macro | Bond HC |
| US Macro | General Domestic Taxable Fixed Income Funds |
| YCharts Categorization | -- |
| YCharts Benchmark | -- |
| Prospectus Objective | General Bond Funds |
| Fund Owner Firm Name | Capital Group |
| Broad Asset Class Benchmark Index | |
| ^BBUSATR | 100.0% |
Fundamentals
| General | |
| Distribution Yield | -- |
| Dividend Yield TTM (6-9-26) | 5.02% |
| 30-Day SEC Yield (4-30-26) | 5.09% |
| 7-Day SEC Yield | -- |
| Number of Holdings | 337 |
| Bond | |
| Yield to Maturity (3-31-26) | 5.11% |
| Effective Duration | 4.80 |
| Average Coupon | 5.01% |
| Calculated Average Quality | 3.040 |
| Effective Maturity | 12.03 |
| Nominal Maturity | 12.10 |
| Number of Bond Holdings | 321 |
As of March 31, 2026
Fund Details
| Key Dates | |
| Inception Date | 9/13/2024 |
| Last Annual Report Date | 12/31/2025 |
| Last Prospectus Date | 3/1/2026 |
| Attributes | |
| Index Fund | -- |
| Inverse Fund | No |
| Leveraged Fund | -- |
| Fund of Funds | No |
| Currency Hedged Fund | -- |
| Socially Responsible Fund | No |
Top Portfolio Holders
| Name | % Weight |
|---|---|
| Portfolio A | 5.00% |
| Portfolio B | 3.50% |
| Portfolio C | 2.25% |
Excel Add-In Codes
| Name: =YCI("M:CBCFX", "name") |
| Broad Asset Class: =YCI("M:CBCFX", "broad_asset_class") |
| Broad Category: =YCI("M:CBCFX", "broad_category_group") |
| Prospectus Objective: =YCI("M:CBCFX", "prospectus_objective") |
| To find the codes for any of our securities and financial metrics, see our Complete Excel Reference. |