

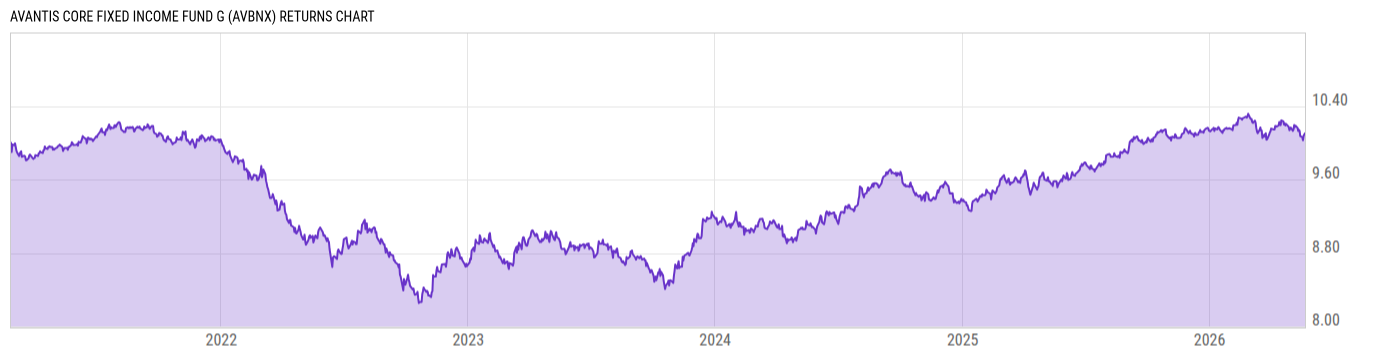
Avantis Core Fixed Income Fund G (AVBNX)
8.34
+0.02
(+0.24%)
USD |
Jun 09 2026
Returns Chart
Key Stats
| Net Expense Ratio | Total Assets Under Management | Weighted Average Dividend Yield | Turnover Ratio (Generic) |
|---|---|---|---|
| 0.00% | 355.56M | -- | 319.0% |
| 1 Year Fund Level Flows | 1 Year Total Returns (Daily) | Annualized Total Returns Since Inception (Daily) | Max Drawdown (Since Inception) |
| 268.80M | 5.38% |
Basic Info
| Investment Strategy | |
| The Fund seeks to maximize total return. The Fund, under normal market conditions, will invest at least 80% of its net assets, plus any borrowings for investment purposes, in fixed income securities. The Fund invests primarily in investment grade quality debt obligations from a diverse group of US and non-US issuers. |
| General | |
| Security Type | Mutual Fund |
| Equity Style | -- |
| Broad Asset Class | Taxable Bond |
| Broad Category | Fixed Income |
| Global Peer Group | Bond USD |
| Peer Group | General Bond Funds |
| Global Macro | Bond HC |
| US Macro | General Domestic Taxable Fixed Income Funds |
| YCharts Categorization | -- |
| YCharts Benchmark | -- |
| Prospectus Objective | General Bond Funds |
| Fund Owner Firm Name | American Century Investments |
| Broad Asset Class Benchmark Index | |
| ^BBUSATR | 100.0% |
Net Fund Flows Versus Peer Group
1 Month
% Rank:
16
-3.511B
Peer Group Low
3.098B
Peer Group High
1 Year
% Rank:
7
268.80M
-647.01M
Peer Group Low
13.23B
Peer Group High
3 Months
% Rank:
9
-2.241B
Peer Group Low
3.962B
Peer Group High
3 Years
% Rank:
17
-12.70B
Peer Group Low
18.00B
Peer Group High
6 Months
% Rank:
6
-3.515B
Peer Group Low
5.649B
Peer Group High
5 Years
% Rank:
23
-1.461B
Peer Group Low
49.86B
Peer Group High
YTD
% Rank:
6
-2.086B
Peer Group Low
5.100B
Peer Group High
10 Years
% Rank:
35
-1.866B
Peer Group Low
81.23B
Peer Group High
Date Unavailable
Risk
Performance Versus Peer Group
Annual Total Returns Versus Peers
As of June 10, 2026.
Asset Allocation
As of March 31, 2026.
| Type | % Net |
|---|---|
| Cash | 0.74% |
| Stock | 0.00% |
| Bond | 99.49% |
| Convertible | 0.00% |
| Preferred | 0.00% |
| Other | -0.23% |
Top 10 Holdings
| Name | % Weight | Price | % Change |
|---|---|---|---|
| United States of America USGB 04/16/2026 FIX USD Government (Matured) | 3.04% | 100.00 | 0.01% |
| FNMA-New 05/01/2039 FIX USD Agency | 1.72% | 93.97 | -0.17% |
| State Street US Government Money Market Fund Prem | 1.56% | 1.00 | 0.00% |
| United States of America USGB 04/07/2026 FIX USD Government (Matured) | 1.52% | 100.00 | 0.01% |
| United States of America USGB 04/09/2026 FIX USD Government (Matured) | 1.45% | 100.00 | 0.01% |
|
Federal National Mortgage Association 4% 01-APR-2056
|
1.44% | -- | -- |
|
Government National Mortgage Association 2 5% 01-JUN-2056
|
1.35% | -- | -- |
|
Government National Mortgage Association 2 3.5% 01-APR-2056
|
1.12% | -- | -- |
|
Government National Mortgage Association 2 5% 01-APR-2056
|
1.06% | -- | -- |
| Government National Mortgage Association GNMA 05/15/2048 FIX USD Agency | 0.97% | 88.79 | -0.33% |
Fees & Availability
| Fees | |
| Actual 12B-1 Fee | -- |
| Actual Management Fee | 0.15% |
| Administration Fee | -- |
| Maximum Front Load | -- |
| Maximum Deferred Load | -- |
| Maximum Redemption Fee | -- |
| General Availability | |
| Available for Insurance Product | No |
| Available for RRSP | No |
| Purchase Details | |
| Open to New Investors |
|
| Minimum Initial Investment | 0.00 None |
| Minimum Subsequent Investment | 0.00 None |
Basic Info
| Investment Strategy | |
| The Fund seeks to maximize total return. The Fund, under normal market conditions, will invest at least 80% of its net assets, plus any borrowings for investment purposes, in fixed income securities. The Fund invests primarily in investment grade quality debt obligations from a diverse group of US and non-US issuers. |
| General | |
| Security Type | Mutual Fund |
| Equity Style | -- |
| Broad Asset Class | Taxable Bond |
| Broad Category | Fixed Income |
| Global Peer Group | Bond USD |
| Peer Group | General Bond Funds |
| Global Macro | Bond HC |
| US Macro | General Domestic Taxable Fixed Income Funds |
| YCharts Categorization | -- |
| YCharts Benchmark | -- |
| Prospectus Objective | General Bond Funds |
| Fund Owner Firm Name | American Century Investments |
| Broad Asset Class Benchmark Index | |
| ^BBUSATR | 100.0% |
Fundamentals
| General | |
| Distribution Yield | -- |
| Dividend Yield TTM (6-8-26) | 4.60% |
| 30-Day SEC Yield (5-31-26) | 4.64% |
| 7-Day SEC Yield | -- |
| Number of Holdings | 528 |
| Bond | |
| Yield to Maturity (3-31-26) | 4.65% |
| Effective Duration | 5.85 |
| Average Coupon | 4.38% |
| Calculated Average Quality | 2.520 |
| Effective Maturity | 9.721 |
| Nominal Maturity | 9.744 |
| Number of Bond Holdings | 495 |
As of March 31, 2026
Fund Details
| Key Dates | |
| Inception Date | 2/24/2021 |
| Last Annual Report Date | 8/31/2025 |
| Last Prospectus Date | 1/1/2026 |
| Share Classes | |
| AVIGX | Inst |
| Attributes | |
| Index Fund | -- |
| Inverse Fund | No |
| Leveraged Fund | -- |
| Fund of Funds | No |
| Currency Hedged Fund | -- |
| Socially Responsible Fund | No |
Top Portfolio Holders
| Name | % Weight |
|---|---|
| Portfolio A | 5.00% |
| Portfolio B | 3.50% |
| Portfolio C | 2.25% |
Excel Add-In Codes
| Name: =YCI("M:AVBNX", "name") |
| Broad Asset Class: =YCI("M:AVBNX", "broad_asset_class") |
| Broad Category: =YCI("M:AVBNX", "broad_category_group") |
| Prospectus Objective: =YCI("M:AVBNX", "prospectus_objective") |
| To find the codes for any of our securities and financial metrics, see our Complete Excel Reference. |