

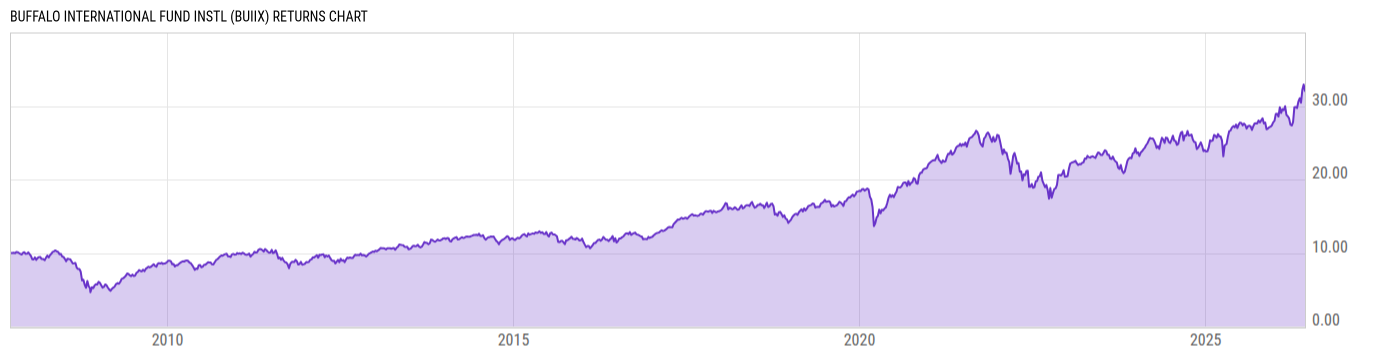
Buffalo International Fund Instl (BUIIX)
27.48
+0.42
(+1.55%)
USD |
Jun 09 2026
Returns Chart
Key Stats
| Net Expense Ratio | Total Assets Under Management | Weighted Average Dividend Yield | Turnover Ratio (Generic) |
|---|---|---|---|
| 0.89% | 876.10M | 1.53% | 10.00% |
| 1 Year Fund Level Flows | 1 Year Total Returns (Daily) | Annualized Total Returns Since Inception (Daily) | Max Drawdown (Since Inception) |
| -177.44M | 17.25% |
Basic Info
| Investment Strategy | |
| The Fund seeks long-term growth of capital. The Fund invests primarily in equity securities of established companies that are economically tied to various countries throughout the world except in US and also, the Fund does not expect its investments in emerging markets to exceed 35% of its net assets. |
| General | |
| Security Type | Mutual Fund |
| Equity Style | Large Cap Growth |
| Broad Asset Class | International Equity |
| Broad Category | Equity |
| Global Peer Group | Equity Global ex US |
| Peer Group | International Multi-Cap Growth |
| Global Macro | Equity Global |
| US Macro | Developed International Markets Funds |
| YCharts Categorization | -- |
| YCharts Benchmark | -- |
| Prospectus Objective | International Funds |
| Fund Owner Firm Name | Buffalo Funds |
| Broad Asset Class Benchmark Index | |
| ^MSACXUSNTR | 100.0% |
Net Fund Flows Versus Peer Group
1 Month
% Rank:
75
-838.82M
Peer Group Low
2.109B
Peer Group High
1 Year
% Rank:
50
-177.44M
-5.807B
Peer Group Low
10.25B
Peer Group High
3 Months
% Rank:
75
-2.168B
Peer Group Low
4.623B
Peer Group High
3 Years
% Rank:
29
-10.03B
Peer Group Low
28.45B
Peer Group High
6 Months
% Rank:
64
-4.106B
Peer Group Low
4.086B
Peer Group High
5 Years
% Rank:
11
-8.851B
Peer Group Low
31.22B
Peer Group High
YTD
% Rank:
69
-3.464B
Peer Group Low
3.846B
Peer Group High
10 Years
% Rank:
10
-26.77B
Peer Group Low
43.62B
Peer Group High
Date Unavailable
Risk
Performance Versus Peer Group
Annual Total Returns Versus Peers
As of June 10, 2026.
Asset Allocation
As of December 31, 2025.
| Type | % Net |
|---|---|
| Cash | 0.56% |
| Stock | 98.80% |
| Bond | 0.47% |
| Convertible | 0.00% |
| Preferred | 0.00% |
| Other | 0.18% |
Top 10 Holdings
| Name | % Weight | Price | % Change |
|---|---|---|---|
|
SK HYNIX INC ORD
|
5.63% | -- | -- |
| Taiwan Semiconductor Manufacturing Co., Ltd. | 4.53% | 408.70 | -4.49% |
| Fidelity Instl Government Portfolio I | 3.67% | 1.00 | 0.00% |
| Samsung Electronics Co., Ltd. | 3.15% | 140.00 | 0.00% |
| Schneider Electric SE | 2.95% | 300.00 | -3.38% |
| ASML Holding NV | 2.93% | 1734.48 | -2.44% |
| AstraZeneca PLC | 2.81% | 178.84 | -2.50% |
| Lonza Group AG | 2.65% | 603.54 | -1.90% |
| MercadoLibre, Inc. | 2.35% | 1588.57 | -3.20% |
| Siemens AG | 2.28% | 302.60 | -0.72% |
Fees & Availability
| Fees | |
| Actual 12B-1 Fee | -- |
| Actual Management Fee | 0.85% |
| Administration Fee | -- |
| Maximum Front Load | -- |
| Maximum Deferred Load | -- |
| Maximum Redemption Fee | -- |
| General Availability | |
| Available for Insurance Product | No |
| Available for RRSP | No |
| Purchase Details | |
| Open to New Investors |
|
| Minimum Initial Investment | 250000.0 None |
| Minimum Subsequent Investment | 100.00 None |
Basic Info
| Investment Strategy | |
| The Fund seeks long-term growth of capital. The Fund invests primarily in equity securities of established companies that are economically tied to various countries throughout the world except in US and also, the Fund does not expect its investments in emerging markets to exceed 35% of its net assets. |
| General | |
| Security Type | Mutual Fund |
| Equity Style | Large Cap Growth |
| Broad Asset Class | International Equity |
| Broad Category | Equity |
| Global Peer Group | Equity Global ex US |
| Peer Group | International Multi-Cap Growth |
| Global Macro | Equity Global |
| US Macro | Developed International Markets Funds |
| YCharts Categorization | -- |
| YCharts Benchmark | -- |
| Prospectus Objective | International Funds |
| Fund Owner Firm Name | Buffalo Funds |
| Broad Asset Class Benchmark Index | |
| ^MSACXUSNTR | 100.0% |
Fundamentals
| General | |
| Distribution Yield | -- |
| Dividend Yield TTM (6-8-26) | 0.63% |
| 30-Day SEC Yield | -- |
| 7-Day SEC Yield | -- |
| Number of Holdings | 79 |
| Stock | |
| Weighted Average PE Ratio | 30.43 |
| Weighted Average Price to Sales Ratio | 5.585 |
| Weighted Average Price to Book Ratio | 6.223 |
| Weighted Median ROE | 21.69% |
| Weighted Median ROA | 9.56% |
| ROI (TTM) | 14.65% |
| Return on Investment (TTM) | 14.65% |
| Earning Yield | 0.0405 |
| LT Debt / Shareholders Equity | 0.5054 |
| Number of Equity Holdings | 71 |
As of December 31, 2025
Growth Metrics
| EPS Growth (1Y) | 18.21% |
| EPS Growth (3Y) | 16.82% |
| EPS Growth (5Y) | 16.72% |
| Sales Growth (1Y) | 13.31% |
| Sales Growth (3Y) | 9.04% |
| Sales Growth (5Y) | 10.52% |
| Sales per Share Growth (1Y) | 13.64% |
| Sales per Share Growth (3Y) | 9.06% |
| Operating Cash Flow - Growth Rate (3Y) | 10.97% |
As of December 31, 2025
Fund Details
| Key Dates | |
| Inception Date | 9/28/2007 |
| Last Annual Report Date | 3/31/2025 |
| Last Prospectus Date | 7/29/2025 |
| Share Classes | |
| BUFIX | Inv |
| Attributes | |
| Index Fund | -- |
| Inverse Fund | No |
| Leveraged Fund | -- |
| Fund of Funds | No |
| Currency Hedged Fund | -- |
| Socially Responsible Fund | No |
Top Portfolio Holders
| Name | % Weight |
|---|---|
| Portfolio A | 5.00% |
| Portfolio B | 3.50% |
| Portfolio C | 2.25% |
Excel Add-In Codes
| Name: =YCI("M:BUIIX", "name") |
| Broad Asset Class: =YCI("M:BUIIX", "broad_asset_class") |
| Broad Category: =YCI("M:BUIIX", "broad_category_group") |
| Prospectus Objective: =YCI("M:BUIIX", "prospectus_objective") |
| To find the codes for any of our securities and financial metrics, see our Complete Excel Reference. |