

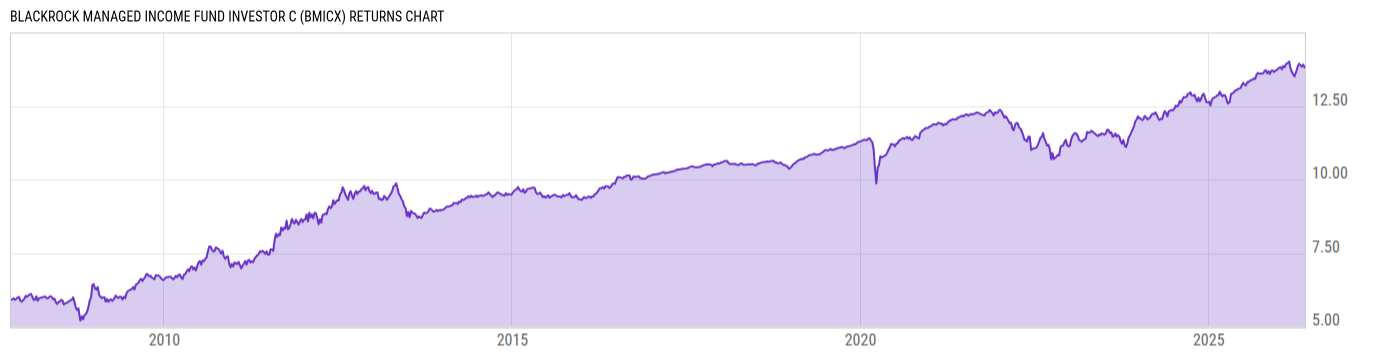
BlackRock Managed Income Fund Investor C (BMICX)
9.64
+0.01
(+0.10%)
USD |
Jun 09 2026
Returns Chart
Key Stats
| Net Expense Ratio | Total Assets Under Management | Weighted Average Dividend Yield | Turnover Ratio (Generic) |
|---|---|---|---|
| 1.45% | 874.73M | -- | 106.0% |
| 1 Year Fund Level Flows | 1 Year Total Returns (Daily) | Annualized Total Returns Since Inception (Daily) | Max Drawdown (Since Inception) |
| 31.69M | 6.12% |
Basic Info
| Investment Strategy | |
| The Fund seeks to maximize total return, consistent with income generation and prudent investment management. The Fund's investments include: U.S. Treasuries and agencies, commercial and residential mortgage-backed securities, CMOs, pass-throughs, asset-backed securities, corporate bonds and municipal bonds. |
| General | |
| Security Type | Mutual Fund |
| Equity Style | -- |
| Broad Asset Class | Taxable Bond |
| Broad Category | Fixed Income |
| Global Peer Group | Bond USD |
| Peer Group | Multi-Sector Income Funds |
| Global Macro | Bond HC |
| US Macro | General Domestic Taxable Fixed Income Funds |
| YCharts Categorization | -- |
| YCharts Benchmark | -- |
| Prospectus Objective | Multi-Sector Income Funds |
| Fund Owner Firm Name | BlackRock |
| Broad Asset Class Benchmark Index | |
| ^BBUSATR | 100.0% |
Net Fund Flows Versus Peer Group
1 Month
% Rank:
72
-144.76M
Peer Group Low
572.86M
Peer Group High
1 Year
% Rank:
47
31.69M
-1.545B
Peer Group Low
30.94B
Peer Group High
3 Months
% Rank:
61
-480.71M
Peer Group Low
1.683B
Peer Group High
3 Years
% Rank:
67
-4.573B
Peer Group Low
71.08B
Peer Group High
6 Months
% Rank:
44
-777.58M
Peer Group Low
12.53B
Peer Group High
5 Years
% Rank:
59
-7.509B
Peer Group Low
61.00B
Peer Group High
YTD
% Rank:
49
-627.92M
Peer Group Low
8.773B
Peer Group High
10 Years
% Rank:
34
-13.91B
Peer Group Low
116.77B
Peer Group High
Date Unavailable
Risk
Performance Versus Peer Group
Annual Total Returns Versus Peers
As of June 10, 2026.
Asset Allocation
As of December 31, 2025.
| Type | % Net |
|---|---|
| Cash | -30.74% |
| Stock | 14.10% |
| Bond | 76.92% |
| Convertible | 0.00% |
| Preferred | 0.02% |
| Other | 39.69% |
Top 10 Holdings
| Name | % Weight | Price | % Change |
|---|---|---|---|
|
5YR T NOTE JUN26
|
17.14% | -- | -- |
|
10Y TNOTES JUN26
|
14.23% | -- | -- |
|
ULTRA BOND JUN26
|
5.78% | -- | -- |
| BlackRock Liquidity T-Fund Institutional | 4.42% | 1.00 | 0.00% |
|
EMINI S&P JUN26
|
1.17% | -- | -- |
| iShares Broad USD High Yield Corporate Bond ETF | 1.12% | 36.85 | 0.11% |
| iShares JP Morgan EM Local Currency Bond ETF | 0.95% | 41.85 | 0.48% |
| United States of America USGB 05/07/2026 FIX USD Government (Matured) | 0.72% | 100.00 | 0.02% |
|
SOCIETE GENERALE SA ELN
|
0.63% | -- | -- |
| iShares Core MSCI Emerging Markets ETF | 0.60% | 80.04 | 0.09% |
Fees & Availability
| Fees | |
| Actual 12B-1 Fee | 1.00% |
| Actual Management Fee | 0.13% |
| Administration Fee | 9.25K% |
| Maximum Front Load | -- |
| Maximum Deferred Load | 1.00% |
| Maximum Redemption Fee | -- |
| General Availability | |
| Available for Insurance Product | No |
| Available for RRSP | No |
| Purchase Details | |
| Open to New Investors |
|
| Minimum Initial Investment | 1000.00 None |
| Minimum Subsequent Investment | 50.00 None |
Basic Info
| Investment Strategy | |
| The Fund seeks to maximize total return, consistent with income generation and prudent investment management. The Fund's investments include: U.S. Treasuries and agencies, commercial and residential mortgage-backed securities, CMOs, pass-throughs, asset-backed securities, corporate bonds and municipal bonds. |
| General | |
| Security Type | Mutual Fund |
| Equity Style | -- |
| Broad Asset Class | Taxable Bond |
| Broad Category | Fixed Income |
| Global Peer Group | Bond USD |
| Peer Group | Multi-Sector Income Funds |
| Global Macro | Bond HC |
| US Macro | General Domestic Taxable Fixed Income Funds |
| YCharts Categorization | -- |
| YCharts Benchmark | -- |
| Prospectus Objective | Multi-Sector Income Funds |
| Fund Owner Firm Name | BlackRock |
| Broad Asset Class Benchmark Index | |
| ^BBUSATR | 100.0% |
Fundamentals
| General | |
| Distribution Yield | -- |
| Dividend Yield TTM (6-8-26) | 4.51% |
| 30-Day SEC Yield (4-30-26) | 4.23% |
| 7-Day SEC Yield | -- |
| Number of Holdings | 10 |
| Stock | |
| Weighted Average PE Ratio | -- |
| Weighted Average Price to Sales Ratio | -- |
| Weighted Average Price to Book Ratio | -- |
| Weighted Median ROE | -- |
| Weighted Median ROA | -- |
| ROI (TTM) | -- |
| Return on Investment (TTM) | -- |
| Earning Yield | -- |
| LT Debt / Shareholders Equity | -- |
| Number of Equity Holdings | 0 |
| Bond | |
| Yield to Maturity (12-31-25) | 4.69% |
| Effective Duration | 4.13 |
| Average Coupon | 5.21% |
| Calculated Average Quality | 3.056 |
| Effective Maturity | 9.676 |
| Nominal Maturity | 9.969 |
| Number of Bond Holdings | 1 |
As of December 31, 2025
Growth Metrics
| EPS Growth (1Y) | -- |
| EPS Growth (3Y) | -- |
| EPS Growth (5Y) | -- |
| Sales Growth (1Y) | -- |
| Sales Growth (3Y) | -- |
| Sales Growth (5Y) | -- |
| Sales per Share Growth (1Y) | -- |
| Sales per Share Growth (3Y) | -- |
| Operating Cash Flow - Growth Rate (3Y) | -- |
As of December 31, 2025
Top Portfolio Holders
| Name | % Weight |
|---|---|
| Portfolio A | 5.00% |
| Portfolio B | 3.50% |
| Portfolio C | 2.25% |
Excel Add-In Codes
| Name: =YCI("M:BMICX", "name") |
| Broad Asset Class: =YCI("M:BMICX", "broad_asset_class") |
| Broad Category: =YCI("M:BMICX", "broad_category_group") |
| Prospectus Objective: =YCI("M:BMICX", "prospectus_objective") |
| To find the codes for any of our securities and financial metrics, see our Complete Excel Reference. |