

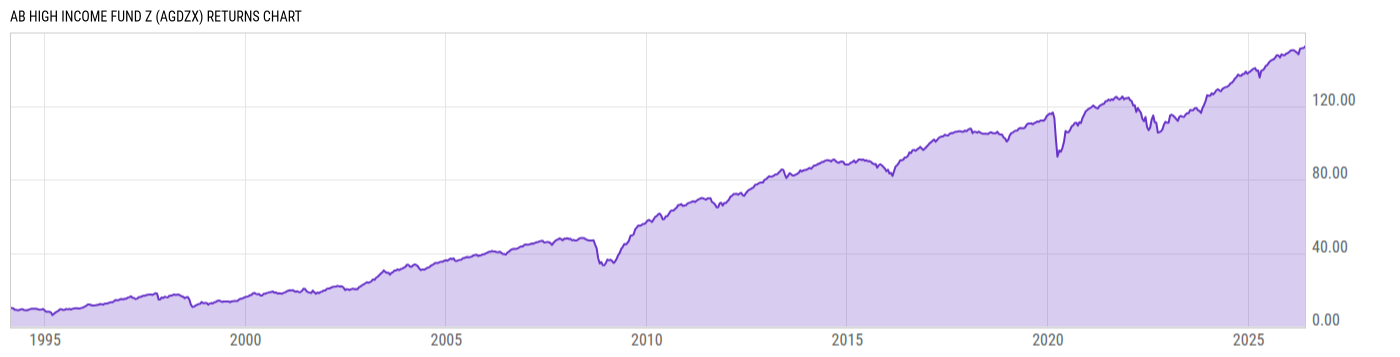
AB High Income Fund Z (AGDZX)
7.02
+0.01
(+0.14%)
USD |
May 29 2026
Returns Chart
Key Stats
| Net Expense Ratio | Total Assets Under Management | Weighted Average Dividend Yield | Turnover Ratio (Generic) |
|---|---|---|---|
| 0.56% | 3.055B | -- | 55.00% |
| 1 Year Fund Level Flows | 1 Year Total Returns (Daily) | Annualized Total Returns Since Inception (Daily) | Max Drawdown (Since Inception) |
| -124.42M | 7.95% |
Basic Info
| Investment Strategy | |
| The Fund seeks primarily a high level of current income and secondarily, capital appreciation. The Fund invests in a non-diversified portfolio of sovereign debt obligations and in US and non-US corporate fixed income securities. Substantially, all of the Fund's assets are invested in lower-rated securities. |
| General | |
| Security Type | Mutual Fund |
| Equity Style | -- |
| Broad Asset Class | Taxable Bond |
| Broad Category | Fixed Income |
| Global Peer Group | Bond Global High Yield USD |
| Peer Group | Global High Yield Funds |
| Global Macro | Bond High Yield |
| US Macro | High Yield Funds |
| YCharts Categorization | -- |
| YCharts Benchmark | -- |
| Prospectus Objective | Global High Yield Funds |
| Fund Owner Firm Name | AllianceBernstein |
| Broad Asset Class Benchmark Index | |
| ^BBUSATR | 100.0% |
Net Fund Flows Versus Peer Group
1 Month
% Rank:
95
-102.99M
Peer Group Low
149.98M
Peer Group High
1 Year
% Rank:
95
-124.42M
-208.83M
Peer Group Low
267.35M
Peer Group High
3 Months
% Rank:
90
-140.79M
Peer Group Low
149.98M
Peer Group High
3 Years
% Rank:
95
-1.177B
Peer Group Low
1.062B
Peer Group High
6 Months
% Rank:
94
-491.00M
Peer Group Low
149.98M
Peer Group High
5 Years
% Rank:
95
-2.590B
Peer Group Low
2.289B
Peer Group High
YTD
% Rank:
94
-303.35M
Peer Group Low
149.98M
Peer Group High
10 Years
% Rank:
97
-5.038B
Peer Group Low
2.289B
Peer Group High
Date Unavailable
Risk
Performance Versus Peer Group
Annual Total Returns Versus Peers
As of May 30, 2026.
Asset Allocation
As of March 31, 2026.
| Type | % Net |
|---|---|
| Cash | 0.18% |
| Stock | 0.66% |
| Bond | 98.33% |
| Convertible | 0.00% |
| Preferred | 0.00% |
| Other | 0.84% |
Top 10 Holdings
| Name | % Weight | Price | % Change |
|---|---|---|---|
|
BRL/Morgan Stanley IRS
|
5.42% | -- | -- |
|
5YR T NOTE JUN26
|
5.08% | -- | -- |
|
Credit Default Swap Index North America High Yield Ser 46 V1 5yrs
|
3.07% | -- | -- |
|
Credit Default Swap Index iTraxx Crossover Ser 45 V1 5yrs
|
1.50% | -- | -- |
|
Credit Default Swap Index North America High Yield Ser 45 V2 5yrs
|
1.13% | -- | -- |
|
USD Cash
|
0.83% | -- | -- |
| AB Government Money Market Portfolio AB | 0.64% | 1.00 | 0.00% |
| DaVita Inc. DAVITIN 4.625 06/01/2030 FIX USD Corporate 144A | 0.59% | 97.17 | -0.11% |
| 1261229 B.C. LTD. BCEC 10.0 04/15/2032 FIX USD Corporate 144A | 0.59% | 102.54 | 0.05% |
|
ULTRA BOND JUN26
|
0.54% | -- | -- |
Fees & Availability
| Fees | |
| Actual 12B-1 Fee | -- |
| Actual Management Fee | 0.48% |
| Administration Fee | -- |
| Maximum Front Load | -- |
| Maximum Deferred Load | -- |
| Maximum Redemption Fee | -- |
| General Availability | |
| Available for Insurance Product | No |
| Available for RRSP | No |
| Purchase Details | |
| Open to New Investors |
|
| Minimum Initial Investment | 0.00 None |
| Minimum Subsequent Investment | 0.00 None |
Basic Info
| Investment Strategy | |
| The Fund seeks primarily a high level of current income and secondarily, capital appreciation. The Fund invests in a non-diversified portfolio of sovereign debt obligations and in US and non-US corporate fixed income securities. Substantially, all of the Fund's assets are invested in lower-rated securities. |
| General | |
| Security Type | Mutual Fund |
| Equity Style | -- |
| Broad Asset Class | Taxable Bond |
| Broad Category | Fixed Income |
| Global Peer Group | Bond Global High Yield USD |
| Peer Group | Global High Yield Funds |
| Global Macro | Bond High Yield |
| US Macro | High Yield Funds |
| YCharts Categorization | -- |
| YCharts Benchmark | -- |
| Prospectus Objective | Global High Yield Funds |
| Fund Owner Firm Name | AllianceBernstein |
| Broad Asset Class Benchmark Index | |
| ^BBUSATR | 100.0% |
Fundamentals
| General | |
| Distribution Yield | -- |
| Dividend Yield TTM (5-28-26) | 7.04% |
| 30-Day SEC Yield (4-30-26) | 6.93% |
| 7-Day SEC Yield | -- |
| Number of Holdings | 1071 |
| Bond | |
| Yield to Maturity (3-31-26) | 7.09% |
| Effective Duration | 3.01 |
| Average Coupon | 6.65% |
| Calculated Average Quality | 5.506 |
| Effective Maturity | 5.139 |
| Nominal Maturity | 6.023 |
| Number of Bond Holdings | 1013 |
As of March 31, 2026
Fund Details
Top Portfolio Holders
| Name | % Weight |
|---|---|
| Portfolio A | 5.00% |
| Portfolio B | 3.50% |
| Portfolio C | 2.25% |
Excel Add-In Codes
| Name: =YCI("M:AGDZX", "name") |
| Broad Asset Class: =YCI("M:AGDZX", "broad_asset_class") |
| Broad Category: =YCI("M:AGDZX", "broad_category_group") |
| Prospectus Objective: =YCI("M:AGDZX", "prospectus_objective") |
| To find the codes for any of our securities and financial metrics, see our Complete Excel Reference. |