

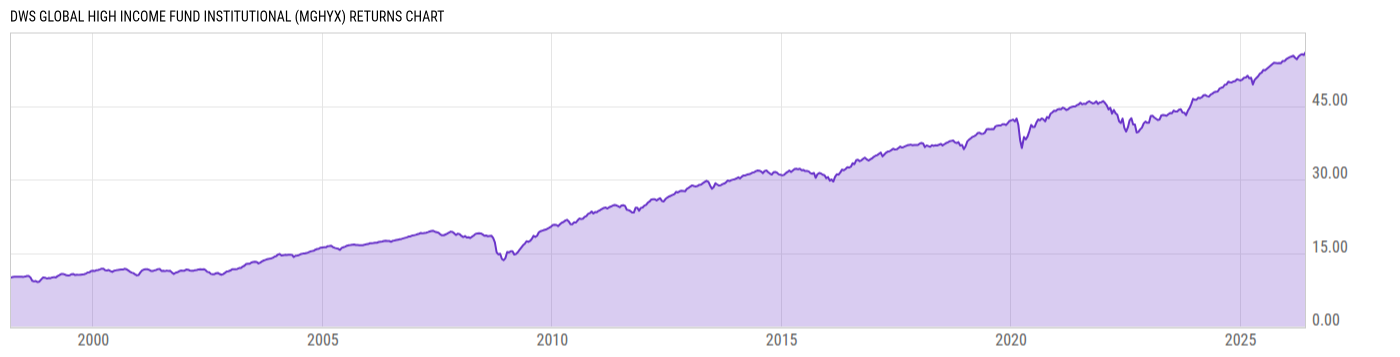
DWS Global High Income Fund Institutional (MGHYX)
6.30
+0.01
(+0.16%)
USD |
May 29 2026
Returns Chart
Key Stats
| Net Expense Ratio | Total Assets Under Management | Weighted Average Dividend Yield | Turnover Ratio (Generic) |
|---|---|---|---|
| 0.74% | 244.94M | -- | 148.0% |
| 1 Year Fund Level Flows | 1 Year Total Returns (Daily) | Annualized Total Returns Since Inception (Daily) | Max Drawdown (Since Inception) |
| -31.67M | 8.67% |
Basic Info
| Investment Strategy | |
| The Fund seeks high current income and, secondarily, capital appreciation. The Fund uses both a "top-down" and "bottom-up" approach to stock selection. The Fund will focus on sector allocations and then using relative value and fundamental analysis to select top securities within each sector. |
| General | |
| Security Type | Mutual Fund |
| Equity Style | -- |
| Broad Asset Class | Taxable Bond |
| Broad Category | Fixed Income |
| Global Peer Group | Bond Global High Yield USD |
| Peer Group | Global High Yield Funds |
| Global Macro | Bond High Yield |
| US Macro | High Yield Funds |
| YCharts Categorization | -- |
| YCharts Benchmark | -- |
| Prospectus Objective | Global High Yield Funds |
| Fund Owner Firm Name | DWS |
| Broad Asset Class Benchmark Index | |
| ^BBUSATR | 100.0% |
Net Fund Flows Versus Peer Group
1 Month
% Rank:
53
-102.99M
Peer Group Low
21.11M
Peer Group High
1 Year
% Rank:
82
-31.67M
-172.98M
Peer Group Low
310.29M
Peer Group High
3 Months
% Rank:
56
-205.83M
Peer Group Low
65.14M
Peer Group High
3 Years
% Rank:
87
-1.170B
Peer Group Low
1.048B
Peer Group High
6 Months
% Rank:
67
-491.00M
Peer Group Low
124.52M
Peer Group High
5 Years
% Rank:
87
-2.565B
Peer Group Low
2.289B
Peer Group High
YTD
% Rank:
62
-303.35M
Peer Group Low
121.26M
Peer Group High
10 Years
% Rank:
55
-4.800B
Peer Group Low
2.289B
Peer Group High
Date Unavailable
Risk
Performance Versus Peer Group
Annual Total Returns Versus Peers
As of May 30, 2026.
Asset Allocation
As of March 31, 2026.
| Type | % Net |
|---|---|
| Cash | 0.01% |
| Stock | 0.68% |
| Bond | 97.51% |
| Convertible | 0.00% |
| Preferred | 0.00% |
| Other | 1.80% |
Top 10 Holdings
| Name | % Weight | Price | % Change |
|---|---|---|---|
| State Street SPDR Portfolio High Yield Bond ETF | 1.59% | 23.53 | 0.21% |
|
DWS Government Cash Management Fund
|
1.53% | -- | -- |
| VODAFONE GROUP PUBLIC LIMITED COMPANY VOD 7.0 04/04/2079 FLT USD Corporate '29 | 1.49% | 103.71 | 0.04% |
| CARNIVAL CORPORATION CCL 5.875 06/15/2031 FIX USD Corporate 144A | 1.42% | 101.54 | 0.18% |
| 1011778 B.C. UNLIMITED LIABILITY COMPANY BCAG 4.0 10/15/2030 FIX USD Corporate 144A | 1.35% | 94.99 | 0.13% |
| CARNIVAL CORPORATION CCL 5.75 08/01/2032 FIX USD Corporate 144A | 1.21% | 101.08 | 0.23% |
| ALPHA GENERATION LLC ALPHGEN 6.25 01/15/2034 FIX USD Corporate 144A | 1.10% | 99.29 | -0.03% |
| VIRGIN MEDIA SECURED FINANCE PLC VIRGMED 5.5 05/15/2029 FIX USD Corporate 144A | 1.09% | 96.31 | 0.12% |
| DISH Network Corporation DISHN 11.75 11/15/2027 FIX USD Corporate 144A | 1.00% | 103.27 | 0.26% |
| ILIAD HOLDING ILIADHO 7.0 10/15/2028 FIX USD Corporate 144A | 0.96% | 100.87 | 0.01% |
Fees & Availability
| Fees | |
| Actual 12B-1 Fee | -- |
| Actual Management Fee | 0.40% |
| Administration Fee | 108.5K% |
| Maximum Front Load | -- |
| Maximum Deferred Load | -- |
| Maximum Redemption Fee | 0.00% |
| General Availability | |
| Available for Insurance Product | No |
| Available for RRSP | No |
| Purchase Details | |
| Open to New Investors |
|
| Minimum Initial Investment | 1.00M None |
| Minimum Subsequent Investment | 0.00 None |
Basic Info
| Investment Strategy | |
| The Fund seeks high current income and, secondarily, capital appreciation. The Fund uses both a "top-down" and "bottom-up" approach to stock selection. The Fund will focus on sector allocations and then using relative value and fundamental analysis to select top securities within each sector. |
| General | |
| Security Type | Mutual Fund |
| Equity Style | -- |
| Broad Asset Class | Taxable Bond |
| Broad Category | Fixed Income |
| Global Peer Group | Bond Global High Yield USD |
| Peer Group | Global High Yield Funds |
| Global Macro | Bond High Yield |
| US Macro | High Yield Funds |
| YCharts Categorization | -- |
| YCharts Benchmark | -- |
| Prospectus Objective | Global High Yield Funds |
| Fund Owner Firm Name | DWS |
| Broad Asset Class Benchmark Index | |
| ^BBUSATR | 100.0% |
Fundamentals
| General | |
| Distribution Yield | -- |
| Dividend Yield TTM (5-28-26) | 6.24% |
| 30-Day SEC Yield (4-30-26) | 5.96% |
| 7-Day SEC Yield | -- |
| Number of Holdings | 287 |
| Bond | |
| Yield to Maturity (3-31-26) | 7.03% |
| Effective Duration | 2.96 |
| Average Coupon | 6.58% |
| Calculated Average Quality | 5.714 |
| Effective Maturity | 5.146 |
| Nominal Maturity | 7.793 |
| Number of Bond Holdings | 278 |
As of March 31, 2026
Fund Details
Top Portfolio Holders
| Name | % Weight |
|---|---|
| Portfolio A | 5.00% |
| Portfolio B | 3.50% |
| Portfolio C | 2.25% |
Excel Add-In Codes
| Name: =YCI("M:MGHYX", "name") |
| Broad Asset Class: =YCI("M:MGHYX", "broad_asset_class") |
| Broad Category: =YCI("M:MGHYX", "broad_category_group") |
| Prospectus Objective: =YCI("M:MGHYX", "prospectus_objective") |
| To find the codes for any of our securities and financial metrics, see our Complete Excel Reference. |