

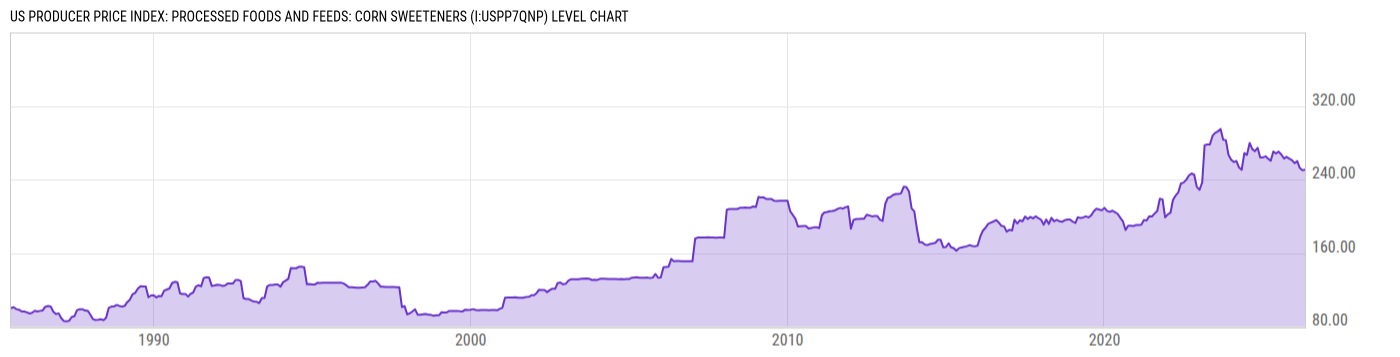
US Producer Price Index: Processed Foods and Feeds: Corn Sweeteners (I:USPP7QNP)
250.77 for Apr 2026
Level Chart
Basic Info
|
US Producer Price Index: Processed Foods and Feeds: Corn Sweeteners is at a current level of 250.77, up from 250.12 last month and down from 270.46 one year ago. This is a change of 0.26% from last month and -7.28% from one year ago. |
| Report | Producer Price Index |
| Category | Producer Prices |
| Region | United States |
| Source | Bureau of Labor Statistics |
Stats
| Last Value | 250.77 |
| Latest Period | Apr 2026 |
| Last Updated | May 13 2026, 12:10 EDT |
| Next Release | Jun 11 2026, 08:30 EDT |
| Average Growth Rate | 2.93% |
| Value from Last Month | 250.12 |
| Change from Last Month | 0.26% |
| Value from 1 Year Ago | 270.46 |
| Change from 1 Year Ago | -7.28% |
| Frequency | Monthly |
| Unit | Index June 1985=100 |
| Adjustment | Not Seasonally Adjusted |
| Download Source File |
Historical Data
| Date | Value |
|---|---|
| April 30, 2026 | 250.77 |
| March 31, 2026 | 250.12 |
| February 28, 2026 | 252.73 |
| January 31, 2026 | 260.04 |
| December 31, 2025 | 257.77 |
| November 30, 2025 | 261.08 |
| October 31, 2025 | 262.73 |
| September 30, 2025 | 264.62 |
| August 31, 2025 | 262.80 |
| July 31, 2025 | 267.19 |
| June 30, 2025 | 270.31 |
| May 31, 2025 | 268.32 |
| April 30, 2025 | 270.46 |
| March 31, 2025 | 260.39 |
| February 28, 2025 | 262.72 |
| January 31, 2025 | 265.22 |
| December 31, 2024 | 264.06 |
| November 30, 2024 | 263.95 |
| October 31, 2024 | 274.44 |
| September 30, 2024 | 270.87 |
| August 31, 2024 | 273.03 |
| July 31, 2024 | 279.79 |
| June 30, 2024 | 266.82 |
| May 31, 2024 | 268.75 |
| April 30, 2024 | 250.54 |
| Date | Value |
|---|---|
| March 31, 2024 | 253.06 |
| February 29, 2024 | 260.20 |
| January 31, 2024 | 258.95 |
| December 31, 2023 | 261.54 |
| November 30, 2023 | 266.98 |
| October 31, 2023 | 282.86 |
| September 30, 2023 | 283.23 |
| August 31, 2023 | 294.93 |
| July 31, 2023 | 292.38 |
| June 30, 2023 | 290.83 |
| May 31, 2023 | 287.69 |
| April 30, 2023 | 278.19 |
| March 31, 2023 | 278.15 |
| February 28, 2023 | 277.40 |
| January 31, 2023 | 236.77 |
| December 31, 2022 | 228.72 |
| November 30, 2022 | 232.02 |
| October 31, 2022 | 245.18 |
| September 30, 2022 | 246.60 |
| August 31, 2022 | 244.40 |
| July 31, 2022 | 239.61 |
| June 30, 2022 | 236.61 |
| May 31, 2022 | 235.60 |
| April 30, 2022 | 225.91 |
| March 31, 2022 | 222.52 |
News
Headline
Time (ET)
05/22 07:41
05/13 15:57
04/23 07:31
Basic Info
|
US Producer Price Index: Processed Foods and Feeds: Corn Sweeteners is at a current level of 250.77, up from 250.12 last month and down from 270.46 one year ago. This is a change of 0.26% from last month and -7.28% from one year ago. |
| Report | Producer Price Index |
| Category | Producer Prices |
| Region | United States |
| Source | Bureau of Labor Statistics |
Stats
| Last Value | 250.77 |
| Latest Period | Apr 2026 |
| Last Updated | May 13 2026, 12:10 EDT |
| Next Release | Jun 11 2026, 08:30 EDT |
| Average Growth Rate | 2.93% |
| Value from Last Month | 250.12 |
| Change from Last Month | 0.26% |
| Value from 1 Year Ago | 270.46 |
| Change from 1 Year Ago | -7.28% |
| Frequency | Monthly |
| Unit | Index June 1985=100 |
| Adjustment | Not Seasonally Adjusted |
| Download Source File |