

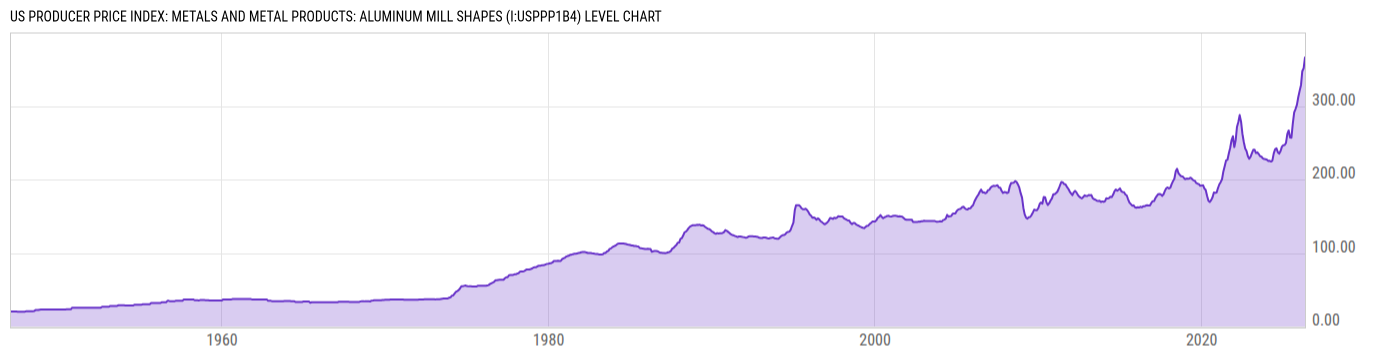
US Producer Price Index: Metals and Metal Products: Aluminum Mill Shapes (I:USPPP1B4)
366.04 for Apr 2026
Level Chart
Basic Info
|
US Producer Price Index: Metals and Metal Products: Aluminum Mill Shapes is at a current level of 366.04, up from 351.29 last month and up from 266.68 one year ago. This is a change of 4.20% from last month and 37.26% from one year ago. |
| Report | Producer Price Index |
| Category | Producer Prices |
| Region | United States |
| Source | Bureau of Labor Statistics |
Stats
| Last Value | 366.04 |
| Latest Period | Apr 2026 |
| Last Updated | May 13 2026, 12:08 EDT |
| Next Release | Jun 11 2026, 08:30 EDT |
| Average Growth Rate | 3.80% |
| Value from Last Month | 351.29 |
| Change from Last Month | 4.20% |
| Value from 1 Year Ago | 266.68 |
| Change from 1 Year Ago | 37.26% |
| Frequency | Monthly |
| Unit | Index 1982=100 |
| Adjustment | Not Seasonally Adjusted |
| Download Source File |
Historical Data
| Date | Value |
|---|---|
| April 30, 2026 | 366.04 |
| March 31, 2026 | 351.29 |
| February 28, 2026 | 347.31 |
| January 31, 2026 | 328.67 |
| December 31, 2025 | 320.59 |
| November 30, 2025 | 311.96 |
| October 31, 2025 | 301.54 |
| September 30, 2025 | 295.90 |
| August 31, 2025 | 291.26 |
| July 31, 2025 | 276.10 |
| June 30, 2025 | 256.71 |
| May 31, 2025 | 257.07 |
| April 30, 2025 | 266.68 |
| March 31, 2025 | 262.06 |
| February 28, 2025 | 249.61 |
| January 31, 2025 | 246.91 |
| December 31, 2024 | 246.62 |
| November 30, 2024 | 244.68 |
| October 31, 2024 | 238.84 |
| September 30, 2024 | 235.14 |
| August 31, 2024 | 237.12 |
| July 31, 2024 | 242.44 |
| June 30, 2024 | 241.06 |
| May 31, 2024 | 235.60 |
| April 30, 2024 | 225.67 |
| Date | Value |
|---|---|
| March 31, 2024 | 224.41 |
| February 29, 2024 | 225.52 |
| January 31, 2024 | 225.15 |
| December 31, 2023 | 226.84 |
| November 30, 2023 | 227.58 |
| October 31, 2023 | 227.86 |
| September 30, 2023 | 228.80 |
| August 31, 2023 | 230.92 |
| July 31, 2023 | 231.72 |
| June 30, 2023 | 234.68 |
| May 31, 2023 | 236.99 |
| April 30, 2023 | 235.99 |
| March 31, 2023 | 240.37 |
| February 28, 2023 | 240.32 |
| January 31, 2023 | 236.33 |
| December 31, 2022 | 231.13 |
| November 30, 2022 | 228.17 |
| October 31, 2022 | 231.68 |
| September 30, 2022 | 238.82 |
| August 31, 2022 | 242.09 |
| July 31, 2022 | 250.97 |
| June 30, 2022 | 262.28 |
| May 31, 2022 | 278.60 |
| April 30, 2022 | 287.61 |
| March 31, 2022 | 278.24 |
News
Headline
Time (ET)
05/22 07:41
05/13 15:57
04/23 07:31
Basic Info
|
US Producer Price Index: Metals and Metal Products: Aluminum Mill Shapes is at a current level of 366.04, up from 351.29 last month and up from 266.68 one year ago. This is a change of 4.20% from last month and 37.26% from one year ago. |
| Report | Producer Price Index |
| Category | Producer Prices |
| Region | United States |
| Source | Bureau of Labor Statistics |
Stats
| Last Value | 366.04 |
| Latest Period | Apr 2026 |
| Last Updated | May 13 2026, 12:08 EDT |
| Next Release | Jun 11 2026, 08:30 EDT |
| Average Growth Rate | 3.80% |
| Value from Last Month | 351.29 |
| Change from Last Month | 4.20% |
| Value from 1 Year Ago | 266.68 |
| Change from 1 Year Ago | 37.26% |
| Frequency | Monthly |
| Unit | Index 1982=100 |
| Adjustment | Not Seasonally Adjusted |
| Download Source File |