

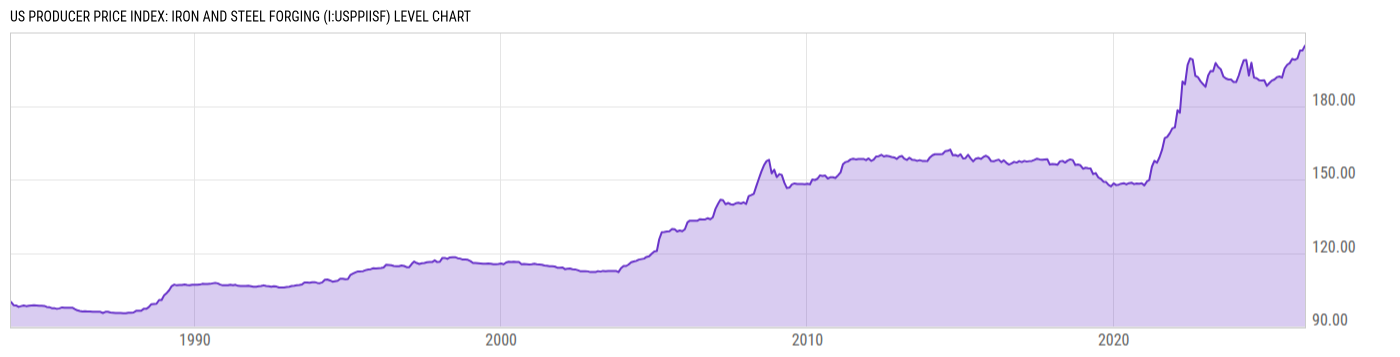
US Producer Price Index: Iron and Steel Forging (I:USPPIISF)
204.59 for Mar 2026
Level Chart
Basic Info
|
US Producer Price Index: Iron and Steel Forging is at a current level of 204.59, up from 202.61 last month and up from 190.83 one year ago. This is a change of 0.98% from last month and 7.21% from one year ago. |
| Report | Producer Price Index |
| Category | Producer Prices |
| Region | United States |
| Source | Bureau of Labor Statistics |
Stats
| Last Value | 204.59 |
| Latest Period | Mar 2026 |
| Last Updated | Apr 14 2026, 09:02 EDT |
| Next Release | May 13 2026, 08:30 EDT |
| Average Growth Rate | 1.74% |
| Value from Last Month | 202.61 |
| Change from Last Month | 0.98% |
| Value from 1 Year Ago | 190.83 |
| Change from 1 Year Ago | 7.21% |
| Frequency | Monthly |
| Unit | Index December 1983=100 |
| Adjustment | Not Seasonally Adjusted |
| Download Source File |
Historical Data
| Date | Value |
|---|---|
| March 31, 2026 | 204.59 |
| February 28, 2026 | 202.61 |
| January 31, 2026 | 202.63 |
| December 31, 2025 | 199.41 |
| November 30, 2025 | 198.85 |
| October 31, 2025 | 199.26 |
| September 30, 2025 | 197.50 |
| August 31, 2025 | 196.82 |
| July 31, 2025 | 195.29 |
| June 30, 2025 | 191.55 |
| May 31, 2025 | 192.04 |
| April 30, 2025 | 191.78 |
| March 31, 2025 | 190.83 |
| February 28, 2025 | 190.34 |
| January 31, 2025 | 189.38 |
| December 31, 2024 | 188.18 |
| November 30, 2024 | 190.51 |
| October 31, 2024 | 190.45 |
| September 30, 2024 | 190.55 |
| August 31, 2024 | 191.31 |
| July 31, 2024 | 191.59 |
| June 30, 2024 | 197.70 |
| May 31, 2024 | 192.43 |
| April 30, 2024 | 198.73 |
| March 31, 2024 | 198.70 |
| Date | Value |
|---|---|
| February 29, 2024 | 195.71 |
| January 31, 2024 | 192.45 |
| December 31, 2023 | 189.78 |
| November 30, 2023 | 189.78 |
| October 31, 2023 | 190.79 |
| September 30, 2023 | 190.80 |
| August 31, 2023 | 191.20 |
| July 31, 2023 | 192.08 |
| June 30, 2023 | 195.04 |
| May 31, 2023 | 195.93 |
| April 30, 2023 | 197.54 |
| March 31, 2023 | 194.20 |
| February 28, 2023 | 194.24 |
| January 31, 2023 | 192.46 |
| December 31, 2022 | 187.83 |
| November 30, 2022 | 188.96 |
| October 31, 2022 | 190.15 |
| September 30, 2022 | 191.83 |
| August 31, 2022 | 192.34 |
| July 31, 2022 | 198.94 |
| June 30, 2022 | 199.42 |
| May 31, 2022 | 196.81 |
| April 30, 2022 | 188.85 |
| March 31, 2022 | 190.01 |
| February 28, 2022 | 177.25 |
News
Headline
Time (ET)
05/01 12:49
04/23 07:31
04/20 08:46
Basic Info
|
US Producer Price Index: Iron and Steel Forging is at a current level of 204.59, up from 202.61 last month and up from 190.83 one year ago. This is a change of 0.98% from last month and 7.21% from one year ago. |
| Report | Producer Price Index |
| Category | Producer Prices |
| Region | United States |
| Source | Bureau of Labor Statistics |
Stats
| Last Value | 204.59 |
| Latest Period | Mar 2026 |
| Last Updated | Apr 14 2026, 09:02 EDT |
| Next Release | May 13 2026, 08:30 EDT |
| Average Growth Rate | 1.74% |
| Value from Last Month | 202.61 |
| Change from Last Month | 0.98% |
| Value from 1 Year Ago | 190.83 |
| Change from 1 Year Ago | 7.21% |
| Frequency | Monthly |
| Unit | Index December 1983=100 |
| Adjustment | Not Seasonally Adjusted |
| Download Source File |