

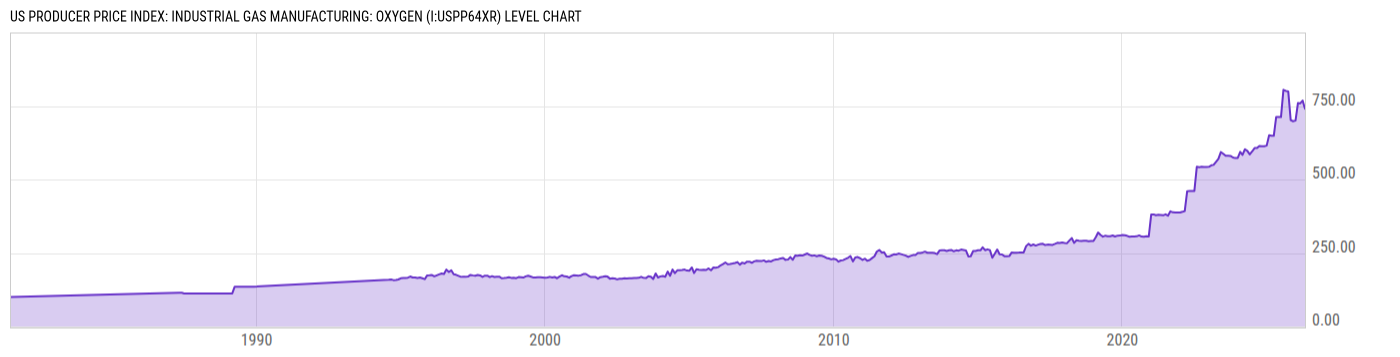
US Producer Price Index: Industrial Gas Manufacturing: Oxygen (I:USPP64XR)
740.54 for Apr 2026
Level Chart
Basic Info
|
US Producer Price Index: Industrial Gas Manufacturing: Oxygen is at a current level of 740.54, down from 768.37 last month and up from 712.44 one year ago. This is a change of -3.62% from last month and 3.94% from one year ago. |
| Report | Producer Price Index |
| Category | Producer Prices |
| Region | United States |
| Source | Bureau of Labor Statistics |
Stats
| Last Value | 740.54 |
| Latest Period | Apr 2026 |
| Last Updated | May 13 2026, 12:06 EDT |
| Next Release | Jun 11 2026, 08:30 EDT |
| Average Growth Rate | 5.62% |
| Value from Last Month | 768.37 |
| Change from Last Month | -3.62% |
| Value from 1 Year Ago | 712.44 |
| Change from 1 Year Ago | 3.94% |
| Frequency | Monthly |
| Unit | Index June 1981=100 |
| Adjustment | Not Seasonally Adjusted |
| Download Source File |
Historical Data
| Date | Value |
|---|---|
| April 30, 2026 | 740.54 |
| March 31, 2026 | 768.37 |
| February 28, 2026 | 758.58 |
| January 31, 2026 | 760.21 |
| December 31, 2025 | 700.26 |
| November 30, 2025 | 698.09 |
| October 31, 2025 | 702.10 |
| September 30, 2025 | 799.73 |
| August 31, 2025 | 801.24 |
| July 31, 2025 | 805.11 |
| June 30, 2025 | 712.39 |
| May 31, 2025 | 712.44 |
| April 30, 2025 | 712.44 |
| March 31, 2025 | 648.51 |
| February 28, 2025 | 648.57 |
| January 31, 2025 | 650.73 |
| December 31, 2024 | 615.26 |
| November 30, 2024 | 613.30 |
| October 31, 2024 | 613.34 |
| September 30, 2024 | 614.22 |
| August 31, 2024 | 606.81 |
| July 31, 2024 | 606.94 |
| June 30, 2024 | 595.32 |
| May 31, 2024 | 585.64 |
| April 30, 2024 | 597.54 |
| Date | Value |
|---|---|
| March 31, 2024 | 602.86 |
| February 29, 2024 | 583.68 |
| January 31, 2024 | 593.98 |
| December 31, 2023 | 573.36 |
| November 30, 2023 | 572.80 |
| October 31, 2023 | 574.86 |
| September 30, 2023 | 580.26 |
| August 31, 2023 | 580.54 |
| July 31, 2023 | 580.82 |
| June 30, 2023 | 587.58 |
| May 31, 2023 | 593.07 |
| April 30, 2023 | 569.97 |
| March 31, 2023 | 560.26 |
| February 28, 2023 | 549.78 |
| January 31, 2023 | 548.16 |
| December 31, 2022 | 543.22 |
| November 30, 2022 | 542.76 |
| October 31, 2022 | 542.63 |
| September 30, 2022 | 543.00 |
| August 31, 2022 | 541.62 |
| July 31, 2022 | 543.51 |
| June 30, 2022 | 461.22 |
| May 31, 2022 | 460.83 |
| April 30, 2022 | 460.47 |
| March 31, 2022 | 460.28 |
News
Headline
Time (ET)
05/22 07:41
05/13 15:57
04/23 07:31
Basic Info
|
US Producer Price Index: Industrial Gas Manufacturing: Oxygen is at a current level of 740.54, down from 768.37 last month and up from 712.44 one year ago. This is a change of -3.62% from last month and 3.94% from one year ago. |
| Report | Producer Price Index |
| Category | Producer Prices |
| Region | United States |
| Source | Bureau of Labor Statistics |
Stats
| Last Value | 740.54 |
| Latest Period | Apr 2026 |
| Last Updated | May 13 2026, 12:06 EDT |
| Next Release | Jun 11 2026, 08:30 EDT |
| Average Growth Rate | 5.62% |
| Value from Last Month | 768.37 |
| Change from Last Month | -3.62% |
| Value from 1 Year Ago | 712.44 |
| Change from 1 Year Ago | 3.94% |
| Frequency | Monthly |
| Unit | Index June 1981=100 |
| Adjustment | Not Seasonally Adjusted |
| Download Source File |