

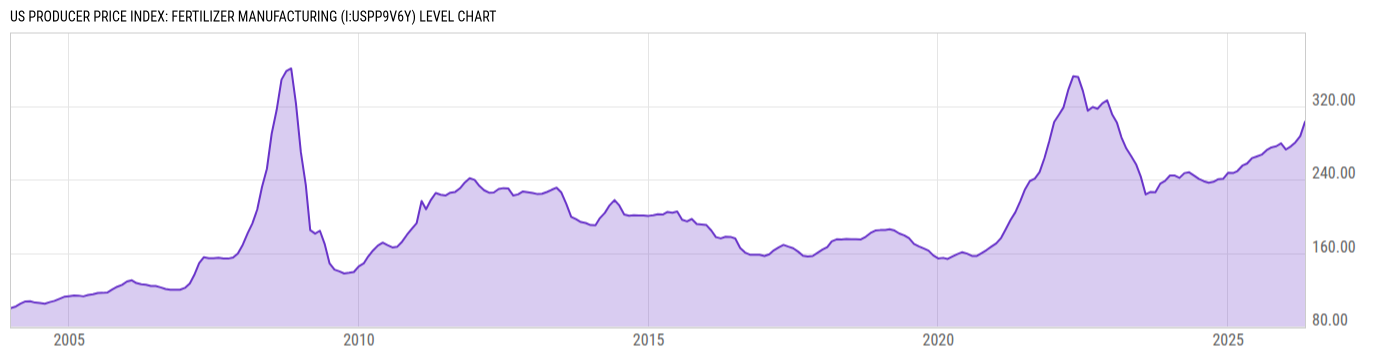
US Producer Price Index: Fertilizer Manufacturing (I:USPP9V6Y)
302.87 for Apr 2026
Level Chart
Basic Info
|
US Producer Price Index: Fertilizer Manufacturing is at a current level of 302.87, up from 287.21 last month and up from 257.40 one year ago. This is a change of 5.45% from last month and 17.66% from one year ago. |
| Report | Producer Price Index |
| Category | Producer Prices |
| Region | United States |
| Source | Bureau of Labor Statistics |
Stats
| Last Value | 302.87 |
| Latest Period | Apr 2026 |
| Last Updated | May 13 2026, 12:04 EDT |
| Next Release | Jun 11 2026, 08:30 EDT |
| Average Growth Rate | 5.85% |
| Value from Last Month | 287.21 |
| Change from Last Month | 5.45% |
| Value from 1 Year Ago | 257.40 |
| Change from 1 Year Ago | 17.66% |
| Frequency | Monthly |
| Unit | Index December 2003=100 |
| Adjustment | Not Seasonally Adjusted |
| Download Source File |
Historical Data
| Date | Value |
|---|---|
| April 30, 2026 | 302.87 |
| March 31, 2026 | 287.21 |
| February 28, 2026 | 280.36 |
| January 31, 2026 | 276.06 |
| December 31, 2025 | 272.62 |
| November 30, 2025 | 279.28 |
| October 31, 2025 | 276.18 |
| September 30, 2025 | 274.85 |
| August 31, 2025 | 271.85 |
| July 31, 2025 | 267.03 |
| June 30, 2025 | 265.09 |
| May 31, 2025 | 263.27 |
| April 30, 2025 | 257.40 |
| March 31, 2025 | 255.01 |
| February 28, 2025 | 249.21 |
| January 31, 2025 | 246.95 |
| December 31, 2024 | 247.29 |
| November 30, 2024 | 240.80 |
| October 31, 2024 | 240.36 |
| September 30, 2024 | 237.49 |
| August 31, 2024 | 236.41 |
| July 31, 2024 | 238.17 |
| June 30, 2024 | 240.73 |
| May 31, 2024 | 244.22 |
| April 30, 2024 | 247.79 |
| Date | Value |
|---|---|
| March 31, 2024 | 246.93 |
| February 29, 2024 | 241.78 |
| January 31, 2024 | 244.26 |
| December 31, 2023 | 244.36 |
| November 30, 2023 | 238.48 |
| October 31, 2023 | 235.51 |
| September 30, 2023 | 226.01 |
| August 31, 2023 | 226.51 |
| July 31, 2023 | 223.73 |
| June 30, 2023 | 243.14 |
| May 31, 2023 | 256.64 |
| April 30, 2023 | 265.54 |
| March 31, 2023 | 273.67 |
| February 28, 2023 | 285.93 |
| January 31, 2023 | 301.66 |
| December 31, 2022 | 311.13 |
| November 30, 2022 | 326.30 |
| October 31, 2022 | 322.84 |
| September 30, 2022 | 316.97 |
| August 31, 2022 | 318.86 |
| July 31, 2022 | 314.74 |
| June 30, 2022 | 336.47 |
| May 31, 2022 | 351.67 |
| April 30, 2022 | 352.28 |
| March 31, 2022 | 338.14 |
News
Headline
Time (ET)
05/13 15:57
05/01 12:49
04/23 07:31
Basic Info
|
US Producer Price Index: Fertilizer Manufacturing is at a current level of 302.87, up from 287.21 last month and up from 257.40 one year ago. This is a change of 5.45% from last month and 17.66% from one year ago. |
| Report | Producer Price Index |
| Category | Producer Prices |
| Region | United States |
| Source | Bureau of Labor Statistics |
Stats
| Last Value | 302.87 |
| Latest Period | Apr 2026 |
| Last Updated | May 13 2026, 12:04 EDT |
| Next Release | Jun 11 2026, 08:30 EDT |
| Average Growth Rate | 5.85% |
| Value from Last Month | 287.21 |
| Change from Last Month | 5.45% |
| Value from 1 Year Ago | 257.40 |
| Change from 1 Year Ago | 17.66% |
| Frequency | Monthly |
| Unit | Index December 2003=100 |
| Adjustment | Not Seasonally Adjusted |
| Download Source File |