

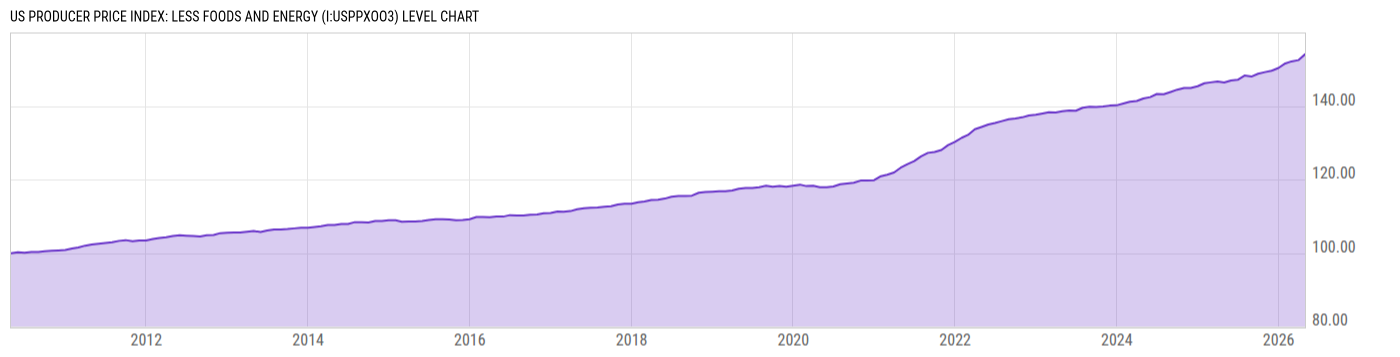
US Producer Price Index: Less Foods and Energy (I:USPPXOO3)
154.06 for Apr 2026
Level Chart
Basic Info
|
US Producer Price Index: Less Foods and Energy is at a current level of 154.06, up from 152.48 last month and up from 146.38 one year ago. This is a change of 1.03% from last month and 5.24% from one year ago. |
| Report | Producer Price Index |
| Category | Producer Prices |
| Region | United States |
| Source | Bureau of Labor Statistics |
Stats
| Last Value | 154.06 |
| Latest Period | Apr 2026 |
| Last Updated | May 13 2026, 08:32 EDT |
| Next Release | Jun 11 2026, 08:30 EDT |
| Average Growth Rate | 2.71% |
| Value from Last Month | 152.48 |
| Change from Last Month | 1.03% |
| Value from 1 Year Ago | 146.38 |
| Change from 1 Year Ago | 5.24% |
| Frequency | Monthly |
| Unit | Index April 2010=100 |
| Adjustment | Seasonally Adjusted |
| Download Source File |
Historical Data
| Date | Value |
|---|---|
| April 30, 2026 | 154.06 |
| March 31, 2026 | 152.48 |
| February 28, 2026 | 152.14 |
| January 31, 2026 | 151.58 |
| December 31, 2025 | 150.35 |
| November 30, 2025 | 149.59 |
| October 31, 2025 | 149.22 |
| September 30, 2025 | 148.77 |
| August 31, 2025 | 148.00 |
| July 31, 2025 | 148.28 |
| June 30, 2025 | 147.12 |
| May 31, 2025 | 146.95 |
| April 30, 2025 | 146.38 |
| March 31, 2025 | 146.69 |
| February 28, 2025 | 146.43 |
| January 31, 2025 | 146.18 |
| December 31, 2024 | 145.37 |
| November 30, 2024 | 144.91 |
| October 31, 2024 | 144.91 |
| September 30, 2024 | 144.44 |
| August 31, 2024 | 143.81 |
| July 31, 2024 | 143.19 |
| June 30, 2024 | 143.26 |
| May 31, 2024 | 142.41 |
| April 30, 2024 | 142.04 |
| Date | Value |
|---|---|
| March 31, 2024 | 141.35 |
| February 29, 2024 | 141.18 |
| January 31, 2024 | 140.68 |
| December 31, 2023 | 140.17 |
| November 30, 2023 | 140.10 |
| October 31, 2023 | 139.86 |
| September 30, 2023 | 139.76 |
| August 31, 2023 | 139.79 |
| July 31, 2023 | 139.52 |
| June 30, 2023 | 138.70 |
| May 31, 2023 | 138.75 |
| April 30, 2023 | 138.56 |
| March 31, 2023 | 138.24 |
| February 28, 2023 | 138.29 |
| January 31, 2023 | 137.98 |
| December 31, 2022 | 137.63 |
| November 30, 2022 | 137.44 |
| October 31, 2022 | 136.91 |
| September 30, 2022 | 136.61 |
| August 31, 2022 | 136.39 |
| July 31, 2022 | 135.88 |
| June 30, 2022 | 135.36 |
| May 31, 2022 | 134.96 |
| April 30, 2022 | 134.29 |
| March 31, 2022 | 133.68 |
News
Headline
Time (ET)
05/22 07:41
05/13 15:57
04/23 07:31
Basic Info
|
US Producer Price Index: Less Foods and Energy is at a current level of 154.06, up from 152.48 last month and up from 146.38 one year ago. This is a change of 1.03% from last month and 5.24% from one year ago. |
| Report | Producer Price Index |
| Category | Producer Prices |
| Region | United States |
| Source | Bureau of Labor Statistics |
Stats
| Last Value | 154.06 |
| Latest Period | Apr 2026 |
| Last Updated | May 13 2026, 08:32 EDT |
| Next Release | Jun 11 2026, 08:30 EDT |
| Average Growth Rate | 2.71% |
| Value from Last Month | 152.48 |
| Change from Last Month | 1.03% |
| Value from 1 Year Ago | 146.38 |
| Change from 1 Year Ago | 5.24% |
| Frequency | Monthly |
| Unit | Index April 2010=100 |
| Adjustment | Seasonally Adjusted |
| Download Source File |