

US Producer Price Index: Chemicals and Allied Products: Nitrogen (I:USPPP2MT)
265.00 for Apr 2026
Level Chart
Basic Info
|
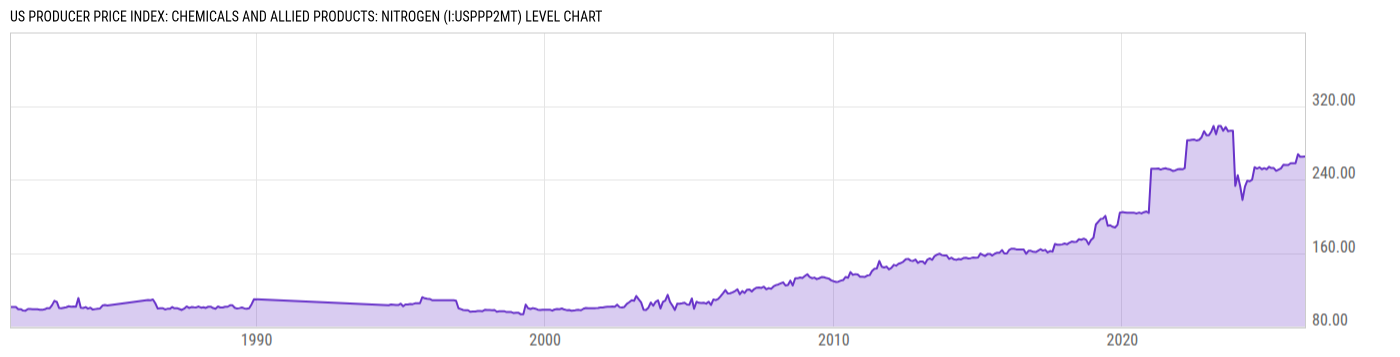
US Producer Price Index: Chemicals and Allied Products: Nitrogen is at a current level of 265.00, up from 264.80 last month and up from 249.47 one year ago. This is a change of 0.08% from last month and 6.22% from one year ago. |
| Report | Producer Price Index |
| Category | Producer Prices |
| Region | United States |
| Source | Bureau of Labor Statistics |
Stats
| Last Value | 265.00 |
| Latest Period | Apr 2026 |
| Last Updated | May 13 2026, 12:03 EDT |
| Next Release | Jun 11 2026, 08:30 EDT |
| Average Growth Rate | 2.87% |
| Value from Last Month | 264.80 |
| Change from Last Month | 0.08% |
| Value from 1 Year Ago | 249.47 |
| Change from 1 Year Ago | 6.22% |
| Frequency | Monthly |
| Unit | Index 1982=100 |
| Adjustment | Not Seasonally Adjusted |
| Download Source File |
Historical Data
| Date | Value |
|---|---|
| April 30, 2026 | 265.00 |
| March 31, 2026 | 264.80 |
| February 28, 2026 | 264.79 |
| January 31, 2026 | 267.46 |
| December 31, 2025 | 257.75 |
| November 30, 2025 | 257.71 |
| October 31, 2025 | 257.66 |
| September 30, 2025 | 255.72 |
| August 31, 2025 | 255.84 |
| July 31, 2025 | 256.04 |
| June 30, 2025 | 252.13 |
| May 31, 2025 | 250.82 |
| April 30, 2025 | 249.47 |
| March 31, 2025 | 252.44 |
| February 28, 2025 | 252.46 |
| January 31, 2025 | 253.82 |
| December 31, 2024 | 251.15 |
| November 30, 2024 | 252.35 |
| October 31, 2024 | 251.15 |
| September 30, 2024 | 253.25 |
| August 31, 2024 | 251.95 |
| July 31, 2024 | 253.32 |
| June 30, 2024 | 239.84 |
| May 31, 2024 | 238.07 |
| April 30, 2024 | 238.75 |
| Date | Value |
|---|---|
| March 31, 2024 | 232.20 |
| February 29, 2024 | 217.78 |
| January 31, 2024 | 232.69 |
| December 31, 2023 | 244.55 |
| November 30, 2023 | 233.06 |
| October 31, 2023 | 293.19 |
| September 30, 2023 | 293.19 |
| August 31, 2023 | 292.52 |
| July 31, 2023 | 297.10 |
| June 30, 2023 | 293.07 |
| May 31, 2023 | 298.17 |
| April 30, 2023 | 298.14 |
| March 31, 2023 | 289.25 |
| February 28, 2023 | 298.29 |
| January 31, 2023 | 292.33 |
| December 31, 2022 | 288.08 |
| November 30, 2022 | 288.29 |
| October 31, 2022 | 292.59 |
| September 30, 2022 | 285.99 |
| August 31, 2022 | 283.22 |
| July 31, 2022 | 282.38 |
| June 30, 2022 | 283.43 |
| May 31, 2022 | 283.27 |
| April 30, 2022 | 282.70 |
| March 31, 2022 | 282.76 |
News
Headline
Time (ET)
05/13 15:57
05/01 12:49
04/23 07:31
Basic Info
|
US Producer Price Index: Chemicals and Allied Products: Nitrogen is at a current level of 265.00, up from 264.80 last month and up from 249.47 one year ago. This is a change of 0.08% from last month and 6.22% from one year ago. |
| Report | Producer Price Index |
| Category | Producer Prices |
| Region | United States |
| Source | Bureau of Labor Statistics |
Stats
| Last Value | 265.00 |
| Latest Period | Apr 2026 |
| Last Updated | May 13 2026, 12:03 EDT |
| Next Release | Jun 11 2026, 08:30 EDT |
| Average Growth Rate | 2.87% |
| Value from Last Month | 264.80 |
| Change from Last Month | 0.08% |
| Value from 1 Year Ago | 249.47 |
| Change from 1 Year Ago | 6.22% |
| Frequency | Monthly |
| Unit | Index 1982=100 |
| Adjustment | Not Seasonally Adjusted |
| Download Source File |