

US ISM Manufacturing PMI (I:USPMI)
Level Chart
Basic Info
|
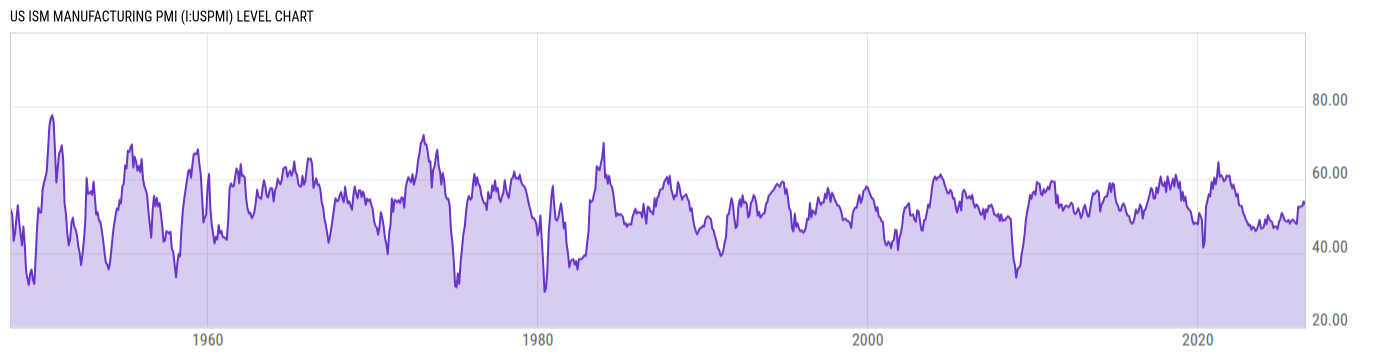
US ISM Manufacturing PMI is at a current level of 53.30, down from 54.00 last month and up from 49.00 one year ago. This is a change of -1.30% from last month and 8.78% from one year ago. |
|
The Purchasing Managers Index is a diffusion index summarizing economic activity in the manufacturing sector in the US. The index is based on a survey of manufacturing supply executives conducted by the Institute of Supply Management. Participants are asked to gauge activity in a number of categories like new orders, inventories, and production and these sub-indices are then combined to create the PMI. A PMI above 50 would designate an overall expansion of the manufacturing economy whereas a PMI below 50 signifies a shrinking of the manufacturing economy. |
| Region | United States |
| Source | Institute for Supply Management |
Stats
| Last Value | 53.30 |
| Latest Period | Jun 2026 |
| Last Updated | Jul 1 2026, 10:03 EDT |
| Next Release | Aug 3 2026, 10:00 EDT |
| Average Growth Rate | 1.66% |
| Value from Last Month | 54.00 |
| Change from Last Month | -1.30% |
| Value from 1 Year Ago | 49.00 |
| Change from 1 Year Ago | 8.78% |
| Frequency | Monthly |
| Adjustment | Seasonally Adjusted |
| Download Source File |
Historical Data
| Date | Value |
|---|---|
| June 30, 2026 | 53.30 |
| May 31, 2026 | 54.00 |
| April 30, 2026 | 52.70 |
| March 31, 2026 | 52.70 |
| February 28, 2026 | 52.40 |
| January 31, 2026 | 52.60 |
| December 31, 2025 | 47.90 |
| November 30, 2025 | 48.20 |
| October 31, 2025 | 48.70 |
| September 30, 2025 | 49.10 |
| August 31, 2025 | 48.70 |
| July 31, 2025 | 48.00 |
| June 30, 2025 | 49.00 |
| May 31, 2025 | 48.50 |
| April 30, 2025 | 48.70 |
| March 31, 2025 | 49.00 |
| February 28, 2025 | 50.30 |
| January 31, 2025 | 50.90 |
| December 31, 2024 | 49.20 |
| November 30, 2024 | 48.40 |
| October 31, 2024 | 46.50 |
| September 30, 2024 | 47.20 |
| August 31, 2024 | 47.20 |
| July 31, 2024 | 46.80 |
| June 30, 2024 | 48.50 |
| Date | Value |
|---|---|
| May 31, 2024 | 48.70 |
| April 30, 2024 | 49.20 |
| March 31, 2024 | 50.30 |
| February 29, 2024 | 47.80 |
| January 31, 2024 | 49.10 |
| December 31, 2023 | 47.10 |
| November 30, 2023 | 46.70 |
| October 31, 2023 | 46.70 |
| September 30, 2023 | 49.00 |
| August 31, 2023 | 47.60 |
| July 31, 2023 | 46.40 |
| June 30, 2023 | 46.00 |
| May 31, 2023 | 46.90 |
| April 30, 2023 | 47.10 |
| March 31, 2023 | 46.30 |
| February 28, 2023 | 47.70 |
| January 31, 2023 | 47.40 |
| December 31, 2022 | 48.40 |
| November 30, 2022 | 49.00 |
| October 31, 2022 | 50.20 |
| September 30, 2022 | 50.90 |
| August 31, 2022 | 52.80 |
| July 31, 2022 | 52.80 |
| June 30, 2022 | 53.00 |
| May 31, 2022 | 56.10 |
News
Basic Info
|
US ISM Manufacturing PMI is at a current level of 53.30, down from 54.00 last month and up from 49.00 one year ago. This is a change of -1.30% from last month and 8.78% from one year ago. |
|
The Purchasing Managers Index is a diffusion index summarizing economic activity in the manufacturing sector in the US. The index is based on a survey of manufacturing supply executives conducted by the Institute of Supply Management. Participants are asked to gauge activity in a number of categories like new orders, inventories, and production and these sub-indices are then combined to create the PMI. A PMI above 50 would designate an overall expansion of the manufacturing economy whereas a PMI below 50 signifies a shrinking of the manufacturing economy. |
| Region | United States |
| Source | Institute for Supply Management |
Stats
| Last Value | 53.30 |
| Latest Period | Jun 2026 |
| Last Updated | Jul 1 2026, 10:03 EDT |
| Next Release | Aug 3 2026, 10:00 EDT |
| Average Growth Rate | 1.66% |
| Value from Last Month | 54.00 |
| Change from Last Month | -1.30% |
| Value from 1 Year Ago | 49.00 |
| Change from 1 Year Ago | 8.78% |
| Frequency | Monthly |
| Adjustment | Seasonally Adjusted |
| Download Source File |
Related Securities
Related Indicators
| US Economy |
| ADP Employment Change | 98000.00 |
| Effective Federal Funds Rate | 3.63% |
| US Durable Goods New Orders MoM | -4.48% |
| US Housing Starts MoM | 19.02% |
| US Imports MoM | 3.27% |
| US Index of Consumer Sentiment | 54.40 |
| US Inflation Rate | 3.50% |
| US Initial Claims for Unemployment Insurance | 208000.0 |
| US Real GDP QoQ | 2.10% |
| US Retail and Food Services Sales MoM | 0.22% |
| US Unemployment Rate | 4.20% |
| US Manufacturing Surveys |
| Other |