

US Import/Export Price Index: Asia Near East: Middle East (I:USIEPIAN)
225.30 for Apr 2026
Level Chart
Basic Info
|
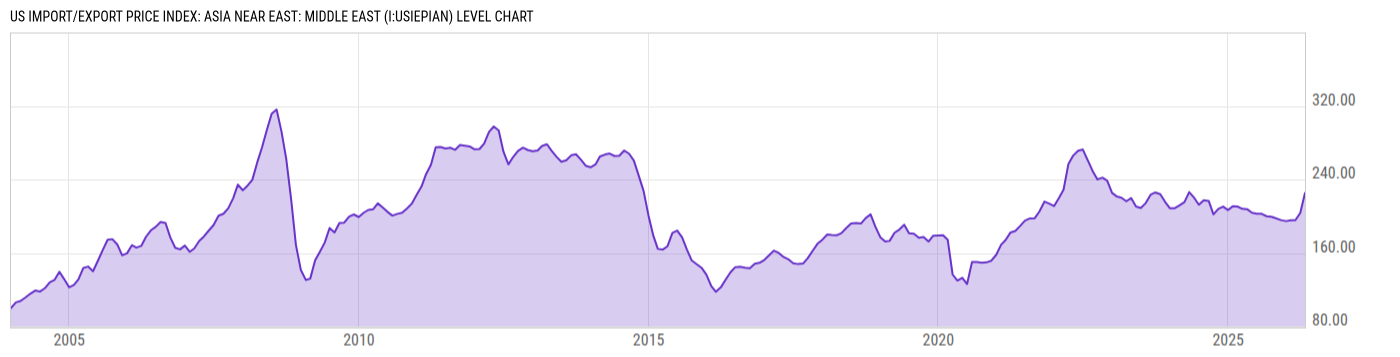
US Import/Export Price Index: Asia Near East: Middle East is at a current level of 225.30, up from 203.60 last month and up from 207.70 one year ago. This is a change of 10.66% from last month and 8.47% from one year ago. |
| Report | Import/Export Price Index |
| Category | International Transactions |
| Region | United States |
| Source | Bureau of Labor Statistics |
Stats
| Last Value | 225.30 |
| Latest Period | Apr 2026 |
| Last Updated | May 14 2026, 10:02 EDT |
| Next Release | Jun 16 2026, 10:00 EDT |
| Average Growth Rate | 5.20% |
| Value from Last Month | 203.60 |
| Change from Last Month | 10.66% |
| Value from 1 Year Ago | 207.70 |
| Change from 1 Year Ago | 8.47% |
| Frequency | Monthly |
| Unit | Index 2003=100 |
| Adjustment | Not Seasonally Adjusted |
| Download Source File |
Historical Data
| Date | Value |
|---|---|
| April 30, 2026 | 225.30 |
| March 31, 2026 | 203.60 |
| February 28, 2026 | 195.60 |
| January 31, 2026 | 195.70 |
| December 31, 2025 | 194.70 |
| November 30, 2025 | 195.80 |
| October 31, 2025 | |
| September 30, 2025 | 199.50 |
| August 31, 2025 | 200.00 |
| July 31, 2025 | 202.70 |
| June 30, 2025 | 202.70 |
| May 31, 2025 | 203.80 |
| April 30, 2025 | 207.70 |
| March 31, 2025 | 208.10 |
| February 28, 2025 | 210.60 |
| January 31, 2025 | 211.00 |
| December 31, 2024 | 206.70 |
| November 30, 2024 | 210.50 |
| October 31, 2024 | 208.10 |
| September 30, 2024 | 202.10 |
| August 31, 2024 | 216.70 |
| July 31, 2024 | 217.50 |
| June 30, 2024 | 212.50 |
| May 31, 2024 | 220.20 |
| April 30, 2024 | 226.30 |
| Date | Value |
|---|---|
| March 31, 2024 | 215.40 |
| February 29, 2024 | 211.80 |
| January 31, 2024 | 208.80 |
| December 31, 2023 | 208.60 |
| November 30, 2023 | 215.70 |
| October 31, 2023 | 223.90 |
| September 30, 2023 | 225.90 |
| August 31, 2023 | 223.50 |
| July 31, 2023 | 214.30 |
| June 30, 2023 | 209.00 |
| May 31, 2023 | 210.60 |
| April 30, 2023 | 219.80 |
| March 31, 2023 | 216.30 |
| February 28, 2023 | 220.20 |
| January 31, 2023 | 221.40 |
| December 31, 2022 | 225.40 |
| November 30, 2022 | 238.70 |
| October 31, 2022 | 242.00 |
| September 30, 2022 | 240.10 |
| August 31, 2022 | 249.10 |
| July 31, 2022 | 260.90 |
| June 30, 2022 | 272.60 |
| May 31, 2022 | 271.20 |
| April 30, 2022 | 266.00 |
| March 31, 2022 | 257.00 |
News
Headline
Time (ET)
05/22 07:41
04/23 07:31
Basic Info
|
US Import/Export Price Index: Asia Near East: Middle East is at a current level of 225.30, up from 203.60 last month and up from 207.70 one year ago. This is a change of 10.66% from last month and 8.47% from one year ago. |
| Report | Import/Export Price Index |
| Category | International Transactions |
| Region | United States |
| Source | Bureau of Labor Statistics |
Stats
| Last Value | 225.30 |
| Latest Period | Apr 2026 |
| Last Updated | May 14 2026, 10:02 EDT |
| Next Release | Jun 16 2026, 10:00 EDT |
| Average Growth Rate | 5.20% |
| Value from Last Month | 203.60 |
| Change from Last Month | 10.66% |
| Value from 1 Year Ago | 207.70 |
| Change from 1 Year Ago | 8.47% |
| Frequency | Monthly |
| Unit | Index 2003=100 |
| Adjustment | Not Seasonally Adjusted |
| Download Source File |