

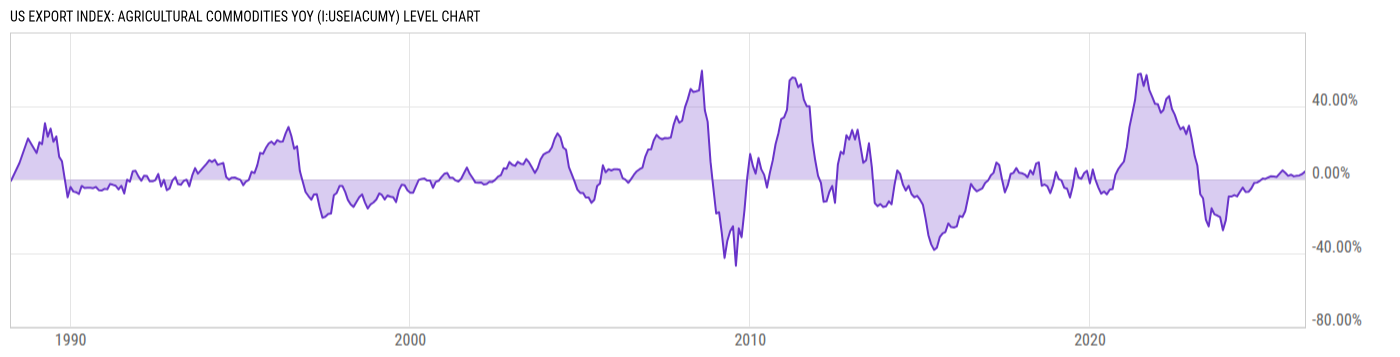
US Export Index: Agricultural Commodities YoY (I:USEIACUMY)
4.30% for Apr 2026
Level Chart
Basic Info
|
US Export Index: Agricultural Commodities YoY is at 4.30%, compared to 3.00% last month and 1.80% last year. This is higher than the long term average of 3.87%. |
| Report | Import/Export Price Index |
| Category | International Transactions |
| Region | United States |
| Source | Bureau of Labor Statistics |
Stats
| Last Value | 4.30% |
| Latest Period | Apr 2026 |
| Last Updated | May 14 2026, 10:05 EDT |
| Next Release | Jun 16 2026, 10:00 EDT |
| Long Term Average | 3.87% |
| Average Growth Rate | 590.5% |
| Value from Last Month | 3.00% |
| Change from Last Month | 43.33% |
| Value from 1 Year Ago | 1.80% |
| Change from 1 Year Ago | 138.9% |
| Frequency | Monthly |
| Unit | Percent Index 2003=100 |
| Adjustment | Not Seasonally Adjusted |
| Download Source File |
Historical Data
| Date | Value |
|---|---|
| April 30, 2026 | 4.30% |
| March 31, 2026 | 3.00% |
| February 28, 2026 | 2.20% |
| January 31, 2026 | 2.00% |
| December 31, 2025 | 1.70% |
| November 30, 2025 | 2.60% |
| October 31, 2025 | 2.00% |
| September 30, 2025 | 3.70% |
| August 31, 2025 | 5.00% |
| July 31, 2025 | 3.20% |
| June 30, 2025 | 1.40% |
| May 31, 2025 | 1.60% |
| April 30, 2025 | 1.80% |
| March 31, 2025 | 1.10% |
| February 28, 2025 | 0.30% |
| January 31, 2025 | 0.50% |
| December 31, 2024 | -0.70% |
| November 30, 2024 | -1.70% |
| October 31, 2024 | -1.90% |
| September 30, 2024 | -4.90% |
| August 31, 2024 | -6.70% |
| July 31, 2024 | -6.80% |
| June 30, 2024 | -4.40% |
| May 31, 2024 | -6.70% |
| April 30, 2024 | -9.20% |
| Date | Value |
|---|---|
| March 31, 2024 | -8.50% |
| February 29, 2024 | -9.30% |
| January 31, 2024 | -9.30% |
| December 31, 2023 | -22.10% |
| November 30, 2023 | -27.60% |
| October 31, 2023 | -20.50% |
| September 30, 2023 | -19.60% |
| August 31, 2023 | -19.00% |
| July 31, 2023 | -15.70% |
| June 30, 2023 | -25.50% |
| May 31, 2023 | -22.00% |
| April 30, 2023 | -10.20% |
| March 31, 2023 | -8.00% |
| February 28, 2023 | 7.60% |
| January 31, 2023 | 12.60% |
| December 31, 2022 | 21.60% |
| November 30, 2022 | 29.30% |
| October 31, 2022 | 24.70% |
| September 30, 2022 | 28.60% |
| August 31, 2022 | 27.30% |
| July 31, 2022 | 30.70% |
| June 30, 2022 | 35.30% |
| May 31, 2022 | 38.40% |
| April 30, 2022 | 45.40% |
| March 31, 2022 | 43.80% |
News
Headline
Time (ET)
05/22 07:41
05/13 15:57
Basic Info
|
US Export Index: Agricultural Commodities YoY is at 4.30%, compared to 3.00% last month and 1.80% last year. This is higher than the long term average of 3.87%. |
| Report | Import/Export Price Index |
| Category | International Transactions |
| Region | United States |
| Source | Bureau of Labor Statistics |
Stats
| Last Value | 4.30% |
| Latest Period | Apr 2026 |
| Last Updated | May 14 2026, 10:05 EDT |
| Next Release | Jun 16 2026, 10:00 EDT |
| Long Term Average | 3.87% |
| Average Growth Rate | 590.5% |
| Value from Last Month | 3.00% |
| Change from Last Month | 43.33% |
| Value from 1 Year Ago | 1.80% |
| Change from 1 Year Ago | 138.9% |
| Frequency | Monthly |
| Unit | Percent Index 2003=100 |
| Adjustment | Not Seasonally Adjusted |
| Download Source File |