

US Unemployment Rate (I:USUR)
Level Chart
Basic Info
|
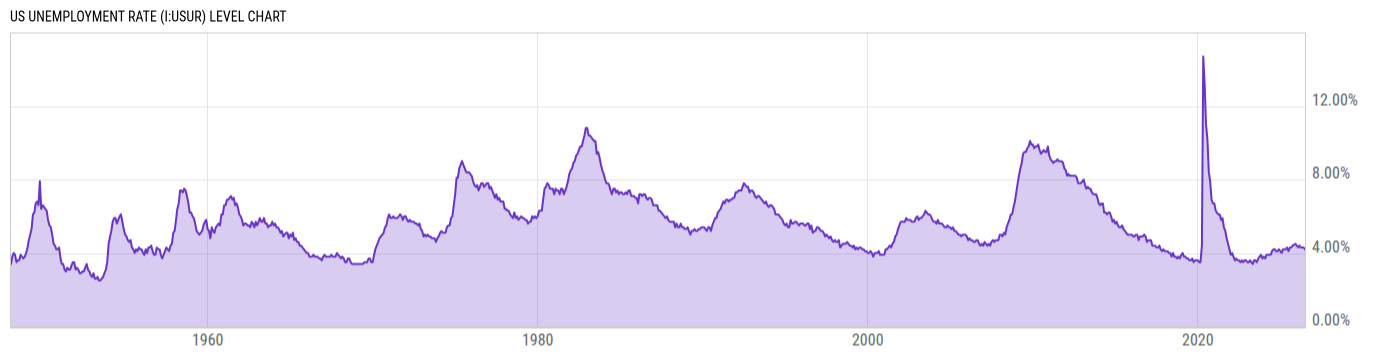
US Unemployment Rate is at 4.20%, compared to 4.30% last month and 4.10% last year. This is lower than the long term average of 5.66%. |
|
The US Unemployment Rate measures the percentage of total employees in the United States that are a part of the labor force, but are without a job. It is one of the most widely followed indicators of the health of the US labor market and the US economy as a whole. Historically, the US Unemployment Rate reached as high as 10.80% in 1982 and 9.9% in November of 2009. Both of these times were notable recessionary periods. |
| Report | Employment Situation |
| Categories | Employment , Hours and Wages |
| Region | United States |
| Source | Bureau of Labor Statistics |
Stats
| Last Value | 4.20% |
| Latest Period | Jun 2026 |
| Last Updated | Jul 2 2026, 08:31 EDT |
| Next Release | Aug 7 2026, 08:30 EDT |
| Long Term Average | 5.66% |
| Average Growth Rate | 2.65% |
| Value from Last Month | 4.30% |
| Change from Last Month | -2.33% |
| Value from 1 Year Ago | 4.10% |
| Change from 1 Year Ago | 2.44% |
| Frequency | Monthly |
| Unit | Percent |
| Adjustment | Seasonally Adjusted |
| Download Source File | |
| Notes | Civilian unemployment rate. |
Historical Data
| Date | Value |
|---|---|
| June 30, 2026 | 4.20% |
| May 31, 2026 | 4.30% |
| April 30, 2026 | 4.30% |
| March 31, 2026 | 4.30% |
| February 28, 2026 | 4.40% |
| January 31, 2026 | 4.30% |
| December 31, 2025 | 4.40% |
| November 30, 2025 | 4.50% |
| October 31, 2025 | |
| September 30, 2025 | 4.40% |
| August 31, 2025 | 4.30% |
| July 31, 2025 | 4.30% |
| June 30, 2025 | 4.10% |
| May 31, 2025 | 4.30% |
| April 30, 2025 | 4.20% |
| March 31, 2025 | 4.20% |
| February 28, 2025 | 4.20% |
| January 31, 2025 | 4.00% |
| December 31, 2024 | 4.10% |
| November 30, 2024 | 4.20% |
| October 31, 2024 | 4.10% |
| September 30, 2024 | 4.10% |
| August 31, 2024 | 4.20% |
| July 31, 2024 | 4.20% |
| June 30, 2024 | 4.10% |
| Date | Value |
|---|---|
| May 31, 2024 | 3.90% |
| April 30, 2024 | 3.90% |
| March 31, 2024 | 3.90% |
| February 29, 2024 | 3.90% |
| January 31, 2024 | 3.70% |
| December 31, 2023 | 3.80% |
| November 30, 2023 | 3.70% |
| October 31, 2023 | 3.90% |
| September 30, 2023 | 3.80% |
| August 31, 2023 | 3.70% |
| July 31, 2023 | 3.50% |
| June 30, 2023 | 3.60% |
| May 31, 2023 | 3.60% |
| April 30, 2023 | 3.40% |
| March 31, 2023 | 3.50% |
| February 28, 2023 | 3.60% |
| January 31, 2023 | 3.50% |
| December 31, 2022 | 3.50% |
| November 30, 2022 | 3.60% |
| October 31, 2022 | 3.60% |
| September 30, 2022 | 3.50% |
| August 31, 2022 | 3.60% |
| July 31, 2022 | 3.50% |
| June 30, 2022 | 3.60% |
| May 31, 2022 | 3.60% |
News
Basic Info
|
US Unemployment Rate is at 4.20%, compared to 4.30% last month and 4.10% last year. This is lower than the long term average of 5.66%. |
|
The US Unemployment Rate measures the percentage of total employees in the United States that are a part of the labor force, but are without a job. It is one of the most widely followed indicators of the health of the US labor market and the US economy as a whole. Historically, the US Unemployment Rate reached as high as 10.80% in 1982 and 9.9% in November of 2009. Both of these times were notable recessionary periods. |
| Report | Employment Situation |
| Categories | Employment , Hours and Wages |
| Region | United States |
| Source | Bureau of Labor Statistics |
Stats
| Last Value | 4.20% |
| Latest Period | Jun 2026 |
| Last Updated | Jul 2 2026, 08:31 EDT |
| Next Release | Aug 7 2026, 08:30 EDT |
| Long Term Average | 5.66% |
| Average Growth Rate | 2.65% |
| Value from Last Month | 4.30% |
| Change from Last Month | -2.33% |
| Value from 1 Year Ago | 4.10% |
| Change from 1 Year Ago | 2.44% |
| Frequency | Monthly |
| Unit | Percent |
| Adjustment | Seasonally Adjusted |
| Download Source File | |
| Notes | Civilian unemployment rate. |
Related Indicators
| US Economy |
| ADP Employment Change | 98000.00 |
| Effective Federal Funds Rate | 3.63% |
| US Durable Goods New Orders MoM | 0.32% |
| US Housing Starts MoM | 19.02% |
| US Imports MoM | 3.27% |
| US Index of Consumer Sentiment | 54.40 |
| US Inflation Rate | 3.50% |
| US Initial Claims for Unemployment Insurance | 197000.0 |
| US ISM Manufacturing PMI | 53.30 |
| US Real GDP QoQ | 1.50% |
| US Retail and Food Services Sales MoM | 0.22% |
| US Labor Markets |