

Lowe S Cos Inc (LOW) - Selling Square Feet (I:LSCILOWS)
Level Chart
Basic Info
|
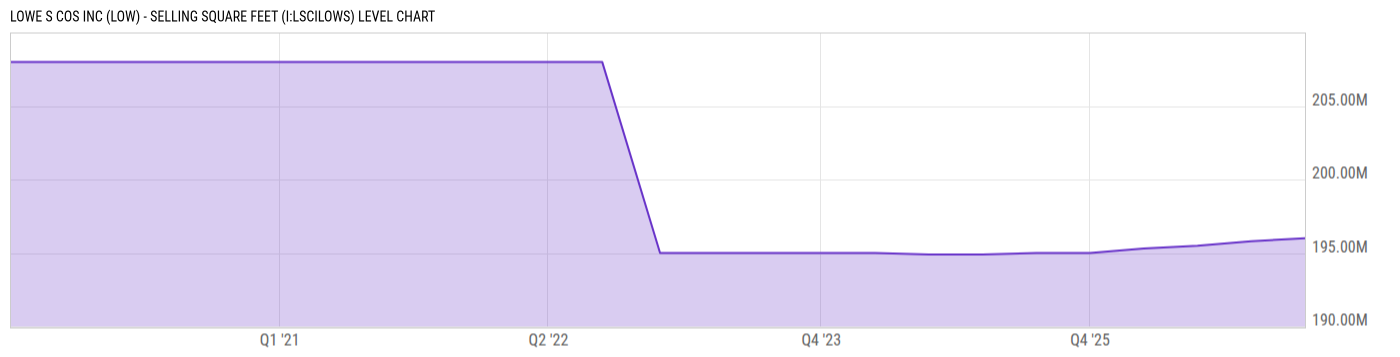
Lowe S Cos Inc (LOW) - Selling Square Feet is at a current level of 196.00M, up from 195.80M last quarter and up from 195.00M one year ago. This is a change of 0.10% from last quarter and 0.51% from one year ago. |
|
Lowe S Cos Inc Selling Square Feet refers to the total floor space or area, measured in square feet, that Lowe's dedicates to retail and selling activities within its stores. |
| Report | Fiscal.ai |
| Category | Segments & KPIs |
| Region | United States |
| Source | Fiscal.ai |
|
Data provided via Fiscal.ai |
Stats
| Last Value | 196.00M |
| Latest Period | Jan 2026 |
| Last Updated | Mar 23 2026, 14:11 EDT |
| Next Release | Jul 15 2026, 08:30 EDT (E) |
| Average Growth Rate | -0.96% |
| Value from Last Quarter | 195.80M |
| Change from Last Quarter | 0.10% |
| Value from 1 Year Ago | 195.00M |
| Change from 1 Year Ago | 0.51% |
| Frequency | Quarterly |
| Adjustment | N/A |
| Download Source File |
Historical Data
| Date | Value |
|---|---|
| January 30, 2026 | 196.00M |
| October 31, 2025 | 195.80M |
| August 01, 2025 | 195.50M |
| May 02, 2025 | 195.30M |
| January 31, 2025 | 195.00M |
| November 01, 2024 | 195.00M |
| August 02, 2024 | 194.90M |
| May 03, 2024 | 194.90M |
| February 02, 2024 | 195.00M |
| November 03, 2023 | 195.00M |
| August 04, 2023 | 195.00M |
| May 05, 2023 | 195.00M |
| February 03, 2023 | 195.00M |
| Date | Value |
|---|---|
| October 28, 2022 | 208.00M |
| July 29, 2022 | 208.00M |
| April 29, 2022 | 208.00M |
| January 28, 2022 | 208.00M |
| October 29, 2021 | 208.00M |
| July 30, 2021 | 208.00M |
| April 30, 2021 | 208.00M |
| January 29, 2021 | 208.00M |
| October 30, 2020 | 208.00M |
| July 31, 2020 | 208.00M |
| May 01, 2020 | 208.00M |
| January 31, 2020 | 208.00M |
News
Basic Info
|
Lowe S Cos Inc (LOW) - Selling Square Feet is at a current level of 196.00M, up from 195.80M last quarter and up from 195.00M one year ago. This is a change of 0.10% from last quarter and 0.51% from one year ago. |
|
Lowe S Cos Inc Selling Square Feet refers to the total floor space or area, measured in square feet, that Lowe's dedicates to retail and selling activities within its stores. |
| Report | Fiscal.ai |
| Category | Segments & KPIs |
| Region | United States |
| Source | Fiscal.ai |
|
Data provided via Fiscal.ai |
Stats
| Last Value | 196.00M |
| Latest Period | Jan 2026 |
| Last Updated | Mar 23 2026, 14:11 EDT |
| Next Release | Jul 15 2026, 08:30 EDT (E) |
| Average Growth Rate | -0.96% |
| Value from Last Quarter | 195.80M |
| Change from Last Quarter | 0.10% |
| Value from 1 Year Ago | 195.00M |
| Change from 1 Year Ago | 0.51% |
| Frequency | Quarterly |
| Adjustment | N/A |
| Download Source File |