

Lowe S Cos Inc (LOW) - Comparable Sales Growth (I:LSCILOWC)
Level Chart
Basic Info
|
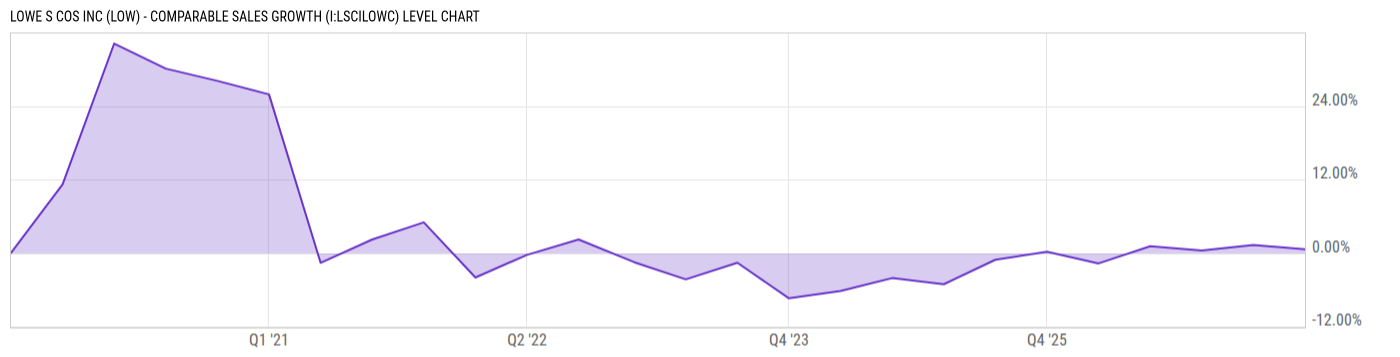
Lowe S Cos Inc (LOW) - Comparable Sales Growth is at 0.60%, compared to 1.30% last quarter and 0.20% last year. This is lower than the long term average of 3.98%. |
|
Lowe S Cos Inc Comparable Sales Growth represents the increase or decrease in sales revenue from stores that have been open for at least a year, providing a clear measure of a store's performance in generating increased revenue from its existing customer base. |
| Report | Fiscal.ai |
| Category | Segments & KPIs |
| Region | United States |
| Source | Fiscal.ai |
|
Data provided via Fiscal.ai |
Stats
| Last Value | 0.60% |
| Latest Period | May 2026 |
| Last Updated | May 20 2026, 18:19 EDT |
| Next Release | Jul 15 2026, 08:30 EDT (E) |
| Long Term Average | 3.98% |
| Average Growth Rate | -342.4% |
| Value from Last Quarter | 1.30% |
| Change from Last Quarter | -53.85% |
| Value from 1 Year Ago | 0.20% |
| Change from 1 Year Ago | 200.0% |
| Frequency | Quarterly |
| Unit | Percent |
| Adjustment | N/A |
| Download Source File |
Historical Data
| Date | Value |
|---|---|
| May 01, 2026 | 0.60% |
| January 30, 2026 | 1.30% |
| October 31, 2025 | 0.40% |
| August 01, 2025 | 1.10% |
| May 02, 2025 | -1.70% |
| January 31, 2025 | 0.20% |
| November 01, 2024 | -1.10% |
| August 02, 2024 | -5.10% |
| May 03, 2024 | -4.10% |
| February 02, 2024 | -6.20% |
| November 03, 2023 | -7.40% |
| August 04, 2023 | -1.60% |
| May 05, 2023 | -4.30% |
| Date | Value |
|---|---|
| February 03, 2023 | -1.50% |
| October 28, 2022 | 2.20% |
| July 29, 2022 | -0.30% |
| April 29, 2022 | -4.00% |
| January 28, 2022 | 5.00% |
| October 29, 2021 | 2.20% |
| July 30, 2021 | -1.60% |
| April 30, 2021 | 25.90% |
| January 29, 2021 | 28.10% |
| October 30, 2020 | 30.10% |
| July 31, 2020 | 34.20% |
| May 01, 2020 | 11.20% |
| January 31, 2020 | 0.00% |
News
Basic Info
|
Lowe S Cos Inc (LOW) - Comparable Sales Growth is at 0.60%, compared to 1.30% last quarter and 0.20% last year. This is lower than the long term average of 3.98%. |
|
Lowe S Cos Inc Comparable Sales Growth represents the increase or decrease in sales revenue from stores that have been open for at least a year, providing a clear measure of a store's performance in generating increased revenue from its existing customer base. |
| Report | Fiscal.ai |
| Category | Segments & KPIs |
| Region | United States |
| Source | Fiscal.ai |
|
Data provided via Fiscal.ai |
Stats
| Last Value | 0.60% |
| Latest Period | May 2026 |
| Last Updated | May 20 2026, 18:19 EDT |
| Next Release | Jul 15 2026, 08:30 EDT (E) |
| Long Term Average | 3.98% |
| Average Growth Rate | -342.4% |
| Value from Last Quarter | 1.30% |
| Change from Last Quarter | -53.85% |
| Value from 1 Year Ago | 0.20% |
| Change from 1 Year Ago | 200.0% |
| Frequency | Quarterly |
| Unit | Percent |
| Adjustment | N/A |
| Download Source File |