

Lowe S Cos Inc (LOW) - Home Decor Revenue (I:LSCILOWH)
Level Chart
Basic Info
|
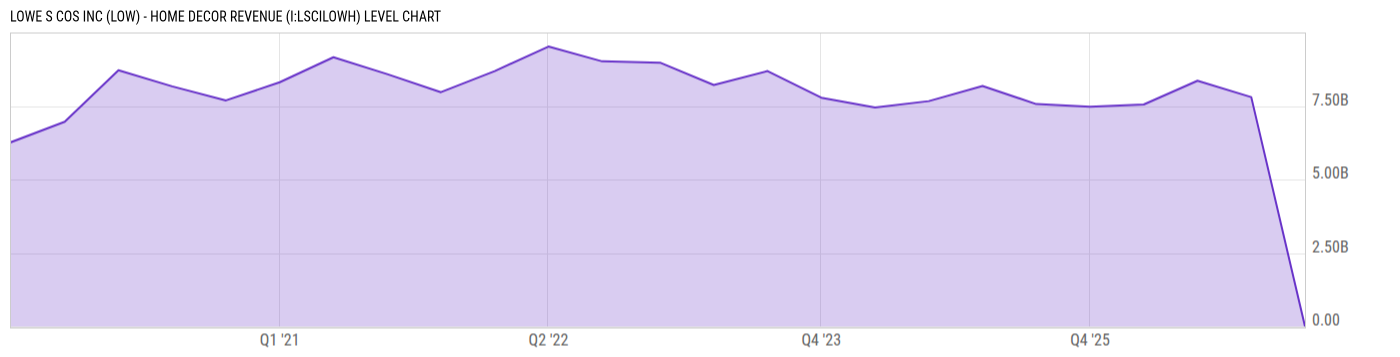
Lowe S Cos Inc (LOW) - Home Decor Revenue is at a current level of 0.000, down from 7.802B last quarter and down from 7.565B one year ago. This is a change of -100.0% from last quarter and -100.0% from one year ago. |
|
Lowe S Cos Inc Home Decor Revenue refers to the income generated by the company from the sale of various home decor items and related products. |
| Report | Fiscal.ai |
| Category | Segments & KPIs |
| Region | United States |
| Source | Fiscal.ai |
|
Data provided via Fiscal.ai |
Stats
| Last Value | 0.00 |
| Latest Period | Jan 2026 |
| Last Updated | Mar 23 2026, 14:11 EDT |
| Next Release | Jul 15 2026, 08:30 EDT (E) |
| Average Growth Rate | -11.61% |
| Value from Last Quarter | 7.802B |
| Change from Last Quarter | -100.0% |
| Value from 1 Year Ago | 7.565B |
| Change from 1 Year Ago | -100.0% |
| Frequency | Quarterly |
| Unit | USD |
| Adjustment | N/A |
| Download Source File |
Historical Data
| Date | Value |
|---|---|
| January 30, 2026 | 0.00 |
| October 31, 2025 | 7.802B |
| August 01, 2025 | 8.359B |
| May 02, 2025 | 7.551B |
| January 31, 2025 | 7.473B |
| November 01, 2024 | 7.565B |
| August 02, 2024 | 8.181B |
| May 03, 2024 | 7.666B |
| February 02, 2024 | 7.45B |
| November 03, 2023 | 7.782B |
| August 04, 2023 | 8.688B |
| May 05, 2023 | 8.215B |
| February 03, 2023 | 8.975B |
| Date | Value |
|---|---|
| October 28, 2022 | 9.019B |
| July 29, 2022 | 9.521B |
| April 29, 2022 | 8.688B |
| January 28, 2022 | 7.97B |
| October 29, 2021 | 8.585B |
| July 30, 2021 | 9.159B |
| April 30, 2021 | 8.307B |
| January 29, 2021 | 7.69B |
| October 30, 2020 | 8.168B |
| July 31, 2020 | 8.714B |
| May 01, 2020 | 6.964B |
| January 31, 2020 | 6.269B |
News
Basic Info
|
Lowe S Cos Inc (LOW) - Home Decor Revenue is at a current level of 0.000, down from 7.802B last quarter and down from 7.565B one year ago. This is a change of -100.0% from last quarter and -100.0% from one year ago. |
|
Lowe S Cos Inc Home Decor Revenue refers to the income generated by the company from the sale of various home decor items and related products. |
| Report | Fiscal.ai |
| Category | Segments & KPIs |
| Region | United States |
| Source | Fiscal.ai |
|
Data provided via Fiscal.ai |
Stats
| Last Value | 0.00 |
| Latest Period | Jan 2026 |
| Last Updated | Mar 23 2026, 14:11 EDT |
| Next Release | Jul 15 2026, 08:30 EDT (E) |
| Average Growth Rate | -11.61% |
| Value from Last Quarter | 7.802B |
| Change from Last Quarter | -100.0% |
| Value from 1 Year Ago | 7.565B |
| Change from 1 Year Ago | -100.0% |
| Frequency | Quarterly |
| Unit | USD |
| Adjustment | N/A |
| Download Source File |