

Light-Duty Electric Vehicles Total Sales (I:LDEVTS)
292282.0 for Apr 2026
Level Chart
Basic Info
|
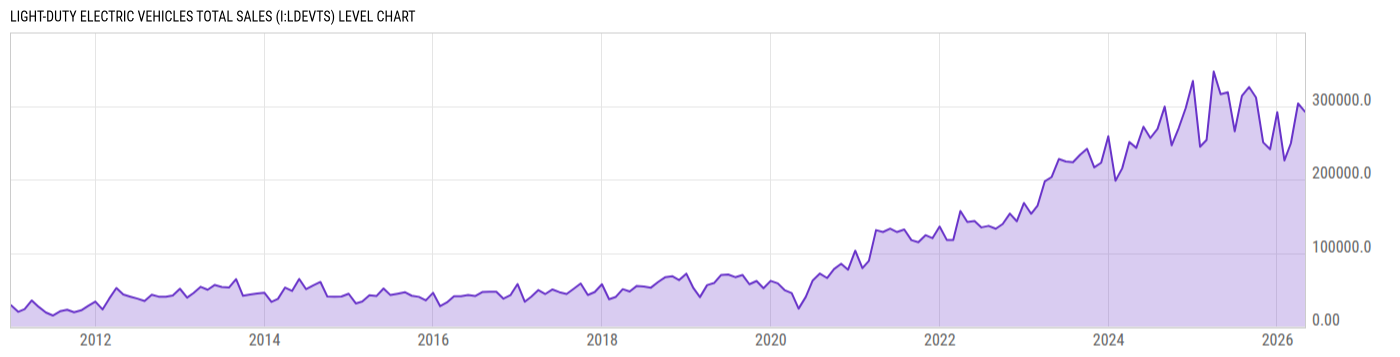
Light-Duty Electric Vehicles Total Sales is at a current level of 292282.0, down from 303381.0 last month and down from 316018.0 one year ago. This is a change of -3.66% from last month and -7.51% from one year ago. |
| Report | Light Duty Electric Drive Vehicles Monthly Sales |
| Categories | Public Health , Transportation |
| Region | United States |
| Source | Argonne National Laboratory |
Stats
| Last Value | 292282.0 |
| Latest Period | Apr 2026 |
| Last Updated | May 21 2026, 08:51 EDT |
| Average Growth Rate | 37.37% |
| Value from Last Month | 303381.0 |
| Change from Last Month | -3.66% |
| Value from 1 Year Ago | 316018.0 |
| Change from 1 Year Ago | -7.51% |
| Frequency | Monthly |
| Adjustment | N/A |
| Notes | Light-Duty Vehicle (car & light truck) sales. |
| Formula | Plug-in Electric Vehicles (PEV) Total Sales + Hybrid Electric Vehicles (HEV) Total Sales |
Historical Data
| Date | Value |
|---|---|
| April 30, 2026 | 292282.0 |
| March 31, 2026 | 303381.0 |
| February 28, 2026 | 249322.0 |
| January 31, 2026 | 225909.0 |
| December 31, 2025 | 291620.0 |
| November 30, 2025 | 241159.0 |
| October 31, 2025 | 250498.0 |
| September 30, 2025 | 311607.0 |
| August 31, 2025 | 325761.0 |
| July 31, 2025 | 313787.0 |
| June 30, 2025 | 265658.0 |
| May 31, 2025 | 318794.0 |
| April 30, 2025 | 316018.0 |
| March 31, 2025 | 346784.0 |
| February 28, 2025 | 253657.0 |
| January 31, 2025 | 244584.0 |
| December 31, 2024 | 334090.0 |
| November 30, 2024 | 297270.0 |
| October 31, 2024 | 270357.0 |
| September 30, 2024 | 246558.0 |
| August 31, 2024 | 299116.0 |
| July 31, 2024 | 268860.0 |
| June 30, 2024 | 256460.0 |
| May 31, 2024 | 271811.0 |
| April 30, 2024 | 243027.0 |
| Date | Value |
|---|---|
| March 31, 2024 | 250987.0 |
| February 29, 2024 | 215128.0 |
| January 31, 2024 | 198392.0 |
| December 31, 2023 | 258745.0 |
| November 30, 2023 | 222783.0 |
| October 31, 2023 | 216434.0 |
| September 30, 2023 | 241763.0 |
| August 31, 2023 | 233648.0 |
| July 31, 2023 | 223476.0 |
| June 30, 2023 | 224527.0 |
| May 31, 2023 | 227822.0 |
| April 30, 2023 | 203410.0 |
| March 31, 2023 | 197392.0 |
| February 28, 2023 | 164563.0 |
| January 31, 2023 | 153349.0 |
| December 31, 2022 | 168080.0 |
| November 30, 2022 | 143154.0 |
| October 31, 2022 | 153521.0 |
| September 30, 2022 | 139509.0 |
| August 31, 2022 | 132966.0 |
| July 31, 2022 | 136914.0 |
| June 30, 2022 | 134834.0 |
| May 31, 2022 | 143386.0 |
| April 30, 2022 | 142261.0 |
| March 31, 2022 | 157043.0 |
News
Headline
Time (ET)
06/01 03:58
05/28 14:17
05/27 04:10
05/07 05:18
Basic Info
|
Light-Duty Electric Vehicles Total Sales is at a current level of 292282.0, down from 303381.0 last month and down from 316018.0 one year ago. This is a change of -3.66% from last month and -7.51% from one year ago. |
| Report | Light Duty Electric Drive Vehicles Monthly Sales |
| Categories | Public Health , Transportation |
| Region | United States |
| Source | Argonne National Laboratory |
Stats
| Last Value | 292282.0 |
| Latest Period | Apr 2026 |
| Last Updated | May 21 2026, 08:51 EDT |
| Average Growth Rate | 37.37% |
| Value from Last Month | 303381.0 |
| Change from Last Month | -3.66% |
| Value from 1 Year Ago | 316018.0 |
| Change from 1 Year Ago | -7.51% |
| Frequency | Monthly |
| Adjustment | N/A |
| Notes | Light-Duty Vehicle (car & light truck) sales. |
| Formula | Plug-in Electric Vehicles (PEV) Total Sales + Hybrid Electric Vehicles (HEV) Total Sales |