

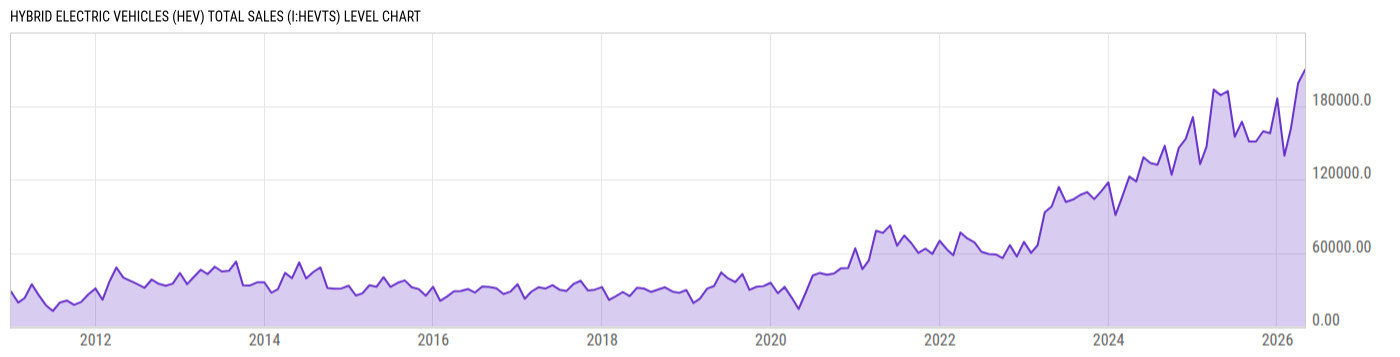
Hybrid Electric Vehicles (HEV) Total Sales (I:HEVTS)
209456.0 for Apr 2026
Level Chart
Basic Info
|
Hybrid Electric Vehicles (HEV) Total Sales is at a current level of 209456.0, up from 198534.0 last month and up from 188865.0 one year ago. This is a change of 5.50% from last month and 10.90% from one year ago. |
| Report | Light Duty Electric Drive Vehicles Monthly Sales |
| Categories | Public Health , Transportation |
| Region | United States |
| Source | Argonne National Laboratory |
Stats
| Last Value | 209456.0 |
| Latest Period | Apr 2026 |
| Last Updated | May 21 2026, 08:51 EDT |
| Next Release | Jun 15 2026, 08:30 EDT (E) |
| Average Growth Rate | 36.52% |
| Value from Last Month | 198534.0 |
| Change from Last Month | 5.50% |
| Value from 1 Year Ago | 188865.0 |
| Change from 1 Year Ago | 10.90% |
| Frequency | Monthly |
| Adjustment | N/A |
| Download Source File | |
| Notes | Light-Duty Vehicle (car & light truck) sales. |
Historical Data
| Date | Value |
|---|---|
| April 30, 2026 | 209456.0 |
| March 31, 2026 | 198534.0 |
| February 28, 2026 | 161580.0 |
| January 31, 2026 | 139429.0 |
| December 31, 2025 | 186080.0 |
| November 30, 2025 | 157758.0 |
| October 31, 2025 | 159431.0 |
| September 30, 2025 | 150988.0 |
| August 31, 2025 | 150988.0 |
| July 31, 2025 | 167183.0 |
| June 30, 2025 | 154889.0 |
| May 31, 2025 | 192226.0 |
| April 30, 2025 | 188865.0 |
| March 31, 2025 | 193384.0 |
| February 28, 2025 | 146846.0 |
| January 31, 2025 | 132576.0 |
| December 31, 2024 | 170935.0 |
| November 30, 2024 | 153163.0 |
| October 31, 2024 | 145838.0 |
| September 30, 2024 | 123864.0 |
| August 31, 2024 | 147521.0 |
| July 31, 2024 | 132114.0 |
| June 30, 2024 | 133533.0 |
| May 31, 2024 | 138118.0 |
| April 30, 2024 | 118435.0 |
| Date | Value |
|---|---|
| March 31, 2024 | 122332.0 |
| February 29, 2024 | 105803.0 |
| January 31, 2024 | 90970.00 |
| December 31, 2023 | 117690.0 |
| November 30, 2023 | 110362.0 |
| October 31, 2023 | 103951.0 |
| September 30, 2023 | 109734.0 |
| August 31, 2023 | 107354.0 |
| July 31, 2023 | 103623.0 |
| June 30, 2023 | 101679.0 |
| May 31, 2023 | 113911.0 |
| April 30, 2023 | 97972.00 |
| March 31, 2023 | 93218.00 |
| February 28, 2023 | 66320.00 |
| January 31, 2023 | 60069.00 |
| December 31, 2022 | 69099.00 |
| November 30, 2022 | 57086.00 |
| October 31, 2022 | 66419.00 |
| September 30, 2022 | 55891.00 |
| August 31, 2022 | 58869.00 |
| July 31, 2022 | 59229.00 |
| June 30, 2022 | 61039.00 |
| May 31, 2022 | 68745.00 |
| April 30, 2022 | 71849.00 |
| March 31, 2022 | 76683.00 |
News
Headline
Time (ET)
05/07 05:18
04/23 06:53
04/22 09:53
Basic Info
|
Hybrid Electric Vehicles (HEV) Total Sales is at a current level of 209456.0, up from 198534.0 last month and up from 188865.0 one year ago. This is a change of 5.50% from last month and 10.90% from one year ago. |
| Report | Light Duty Electric Drive Vehicles Monthly Sales |
| Categories | Public Health , Transportation |
| Region | United States |
| Source | Argonne National Laboratory |
Stats
| Last Value | 209456.0 |
| Latest Period | Apr 2026 |
| Last Updated | May 21 2026, 08:51 EDT |
| Next Release | Jun 15 2026, 08:30 EDT (E) |
| Average Growth Rate | 36.52% |
| Value from Last Month | 198534.0 |
| Change from Last Month | 5.50% |
| Value from 1 Year Ago | 188865.0 |
| Change from 1 Year Ago | 10.90% |
| Frequency | Monthly |
| Adjustment | N/A |
| Download Source File | |
| Notes | Light-Duty Vehicle (car & light truck) sales. |