

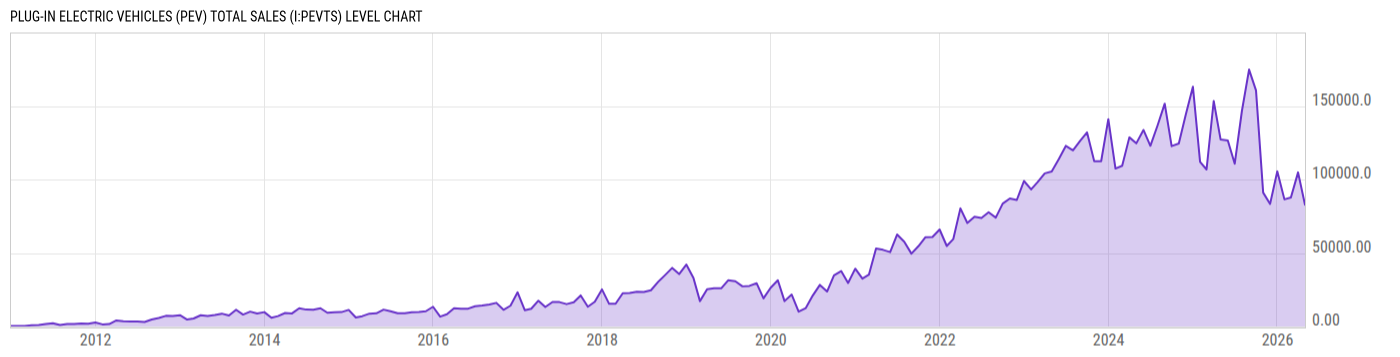
Plug-in Electric Vehicles (PEV) Total Sales (I:PEVTS)
82826.00 for Apr 2026
Level Chart
Basic Info
|
Plug-in Electric Vehicles (PEV) Total Sales is at a current level of 82826.00, down from 104847.0 last month and down from 127153.0 one year ago. This is a change of -21.00% from last month and -34.86% from one year ago. |
| Report | Light Duty Electric Drive Vehicles Monthly Sales |
| Categories | Public Health , Transportation |
| Region | United States |
| Source | Argonne National Laboratory |
Stats
| Last Value | 82826.00 |
| Latest Period | Apr 2026 |
| Last Updated | May 21 2026, 08:51 EDT |
| Average Growth Rate | 79.64% |
| Value from Last Month | 104847.0 |
| Change from Last Month | -21.00% |
| Value from 1 Year Ago | 127153.0 |
| Change from 1 Year Ago | -34.86% |
| Frequency | Monthly |
| Adjustment | N/A |
| Notes | Light-Duty Vehicle (car & light truck) sales. |
| Formula | Plug-In Battery Electric Vehicles (BEV) Total Sales + Plug-in Hybrid Electric Vehicles (PHEV) Total Sales |
Historical Data
| Date | Value |
|---|---|
| April 30, 2026 | 82826.00 |
| March 31, 2026 | 104847.0 |
| February 28, 2026 | 87742.00 |
| January 31, 2026 | 86480.00 |
| December 31, 2025 | 105540.0 |
| November 30, 2025 | 83401.00 |
| October 31, 2025 | 91067.00 |
| September 30, 2025 | 160619.0 |
| August 31, 2025 | 174773.0 |
| July 31, 2025 | 146604.0 |
| June 30, 2025 | 110769.0 |
| May 31, 2025 | 126568.0 |
| April 30, 2025 | 127153.0 |
| March 31, 2025 | 153400.0 |
| February 28, 2025 | 106811.0 |
| January 31, 2025 | 112008.0 |
| December 31, 2024 | 163155.0 |
| November 30, 2024 | 144107.0 |
| October 31, 2024 | 124519.0 |
| September 30, 2024 | 122694.0 |
| August 31, 2024 | 151595.0 |
| July 31, 2024 | 136746.0 |
| June 30, 2024 | 122927.0 |
| May 31, 2024 | 133693.0 |
| April 30, 2024 | 124592.0 |
| Date | Value |
|---|---|
| March 31, 2024 | 128655.0 |
| February 29, 2024 | 109325.0 |
| January 31, 2024 | 107422.0 |
| December 31, 2023 | 141055.0 |
| November 30, 2023 | 112421.0 |
| October 31, 2023 | 112483.0 |
| September 30, 2023 | 132029.0 |
| August 31, 2023 | 126294.0 |
| July 31, 2023 | 119853.0 |
| June 30, 2023 | 122848.0 |
| May 31, 2023 | 113911.0 |
| April 30, 2023 | 105438.0 |
| March 31, 2023 | 104174.0 |
| February 28, 2023 | 98243.00 |
| January 31, 2023 | 93280.00 |
| December 31, 2022 | 98981.00 |
| November 30, 2022 | 86068.00 |
| October 31, 2022 | 87102.00 |
| September 30, 2022 | 83618.00 |
| August 31, 2022 | 74097.00 |
| July 31, 2022 | 77685.00 |
| June 30, 2022 | 73795.00 |
| May 31, 2022 | 74641.00 |
| April 30, 2022 | 70412.00 |
| March 31, 2022 | 80360.00 |
News
Headline
Time (ET)
06/01 03:58
05/27 04:10
Basic Info
|
Plug-in Electric Vehicles (PEV) Total Sales is at a current level of 82826.00, down from 104847.0 last month and down from 127153.0 one year ago. This is a change of -21.00% from last month and -34.86% from one year ago. |
| Report | Light Duty Electric Drive Vehicles Monthly Sales |
| Categories | Public Health , Transportation |
| Region | United States |
| Source | Argonne National Laboratory |
Stats
| Last Value | 82826.00 |
| Latest Period | Apr 2026 |
| Last Updated | May 21 2026, 08:51 EDT |
| Average Growth Rate | 79.64% |
| Value from Last Month | 104847.0 |
| Change from Last Month | -21.00% |
| Value from 1 Year Ago | 127153.0 |
| Change from 1 Year Ago | -34.86% |
| Frequency | Monthly |
| Adjustment | N/A |
| Notes | Light-Duty Vehicle (car & light truck) sales. |
| Formula | Plug-In Battery Electric Vehicles (BEV) Total Sales + Plug-in Hybrid Electric Vehicles (PHEV) Total Sales |