

Finland Industrial Production Index: Mining and Quarrying (I:FIPMQSQ)
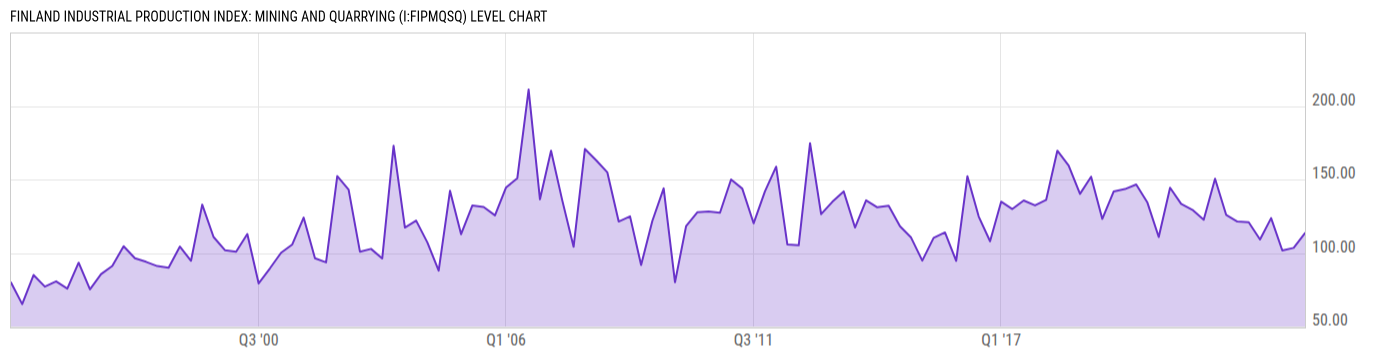
113.50 for Q4 2023
Level Chart
Basic Info
|
Finland Industrial Production Index: Mining and Quarrying is at a current level of 113.50, up from 103.50 last quarter and up from 109.20 one year ago. This is a change of 9.66% from last quarter and 3.94% from one year ago. |
| Report | European Industrial Production |
| Category | Manufacturing Statistics |
Stats
| Last Value | 113.50 |
| Latest Period | Dec 2023 |
| Last Updated | Feb 14 2024, 10:12 EST |
| Next Release | Jun 15 2026, 11:00 EDT |
| Average Growth Rate | 10.21% |
| Value from Last Quarter | 103.50 |
| Change from Last Quarter | 9.66% |
| Value from 1 Year Ago | 109.20 |
| Change from 1 Year Ago | 3.94% |
| Frequency | Quarterly |
| Unit | Index 2015=100 |
| Adjustment | Seasonally and Calendar Adjusted |
| Download Source File |
Historical Data
| Date | Value |
|---|---|
| December 31, 2023 | 113.50 |
| September 30, 2023 | 103.50 |
| June 30, 2023 | 101.70 |
| March 31, 2023 | 123.70 |
| December 31, 2022 | 109.20 |
| September 30, 2022 | 120.90 |
| June 30, 2022 | 121.40 |
| March 31, 2022 | 126.00 |
| December 31, 2021 | 150.50 |
| September 30, 2021 | 122.60 |
| June 30, 2021 | 129.40 |
| March 31, 2021 | 133.40 |
| December 31, 2020 | 144.40 |
| September 30, 2020 | 110.90 |
| June 30, 2020 | 134.30 |
| March 31, 2020 | 146.60 |
| December 31, 2019 | 143.50 |
| September 30, 2019 | 141.80 |
| June 30, 2019 | 123.20 |
| March 31, 2019 | 151.90 |
| December 31, 2018 | 140.20 |
| September 30, 2018 | 159.50 |
| June 30, 2018 | 169.60 |
| March 31, 2018 | 136.10 |
| December 31, 2017 | 132.40 |
| Date | Value |
|---|---|
| September 30, 2017 | 135.70 |
| June 30, 2017 | 129.90 |
| March 31, 2017 | 134.90 |
| December 31, 2016 | 108.00 |
| September 30, 2016 | 124.80 |
| June 30, 2016 | 152.20 |
| March 31, 2016 | 94.60 |
| December 31, 2015 | 114.00 |
| September 30, 2015 | 110.30 |
| June 30, 2015 | 94.80 |
| March 31, 2015 | 110.50 |
| December 31, 2014 | 118.20 |
| September 30, 2014 | 132.10 |
| June 30, 2014 | 131.10 |
| March 31, 2014 | 135.80 |
| December 31, 2013 | 117.30 |
| September 30, 2013 | 141.90 |
| June 30, 2013 | 134.80 |
| March 31, 2013 | 126.40 |
| December 31, 2012 | 174.70 |
| September 30, 2012 | 105.20 |
| June 30, 2012 | 105.70 |
| March 31, 2012 | 158.70 |
| December 31, 2011 | 141.90 |
| September 30, 2011 | 120.20 |
News
Headline
Time (ET)
05/13 15:57
05/13 07:39
04/23 08:36
04/23 07:31
Basic Info
|
Finland Industrial Production Index: Mining and Quarrying is at a current level of 113.50, up from 103.50 last quarter and up from 109.20 one year ago. This is a change of 9.66% from last quarter and 3.94% from one year ago. |
| Report | European Industrial Production |
| Category | Manufacturing Statistics |
Stats
| Last Value | 113.50 |
| Latest Period | Dec 2023 |
| Last Updated | Feb 14 2024, 10:12 EST |
| Next Release | Jun 15 2026, 11:00 EDT |
| Average Growth Rate | 10.21% |
| Value from Last Quarter | 103.50 |
| Change from Last Quarter | 9.66% |
| Value from 1 Year Ago | 109.20 |
| Change from 1 Year Ago | 3.94% |
| Frequency | Quarterly |
| Unit | Index 2015=100 |
| Adjustment | Seasonally and Calendar Adjusted |
| Download Source File |