

Ethereum Average Transaction Fee (I:EATFND)
Level Chart
Basic Info
|
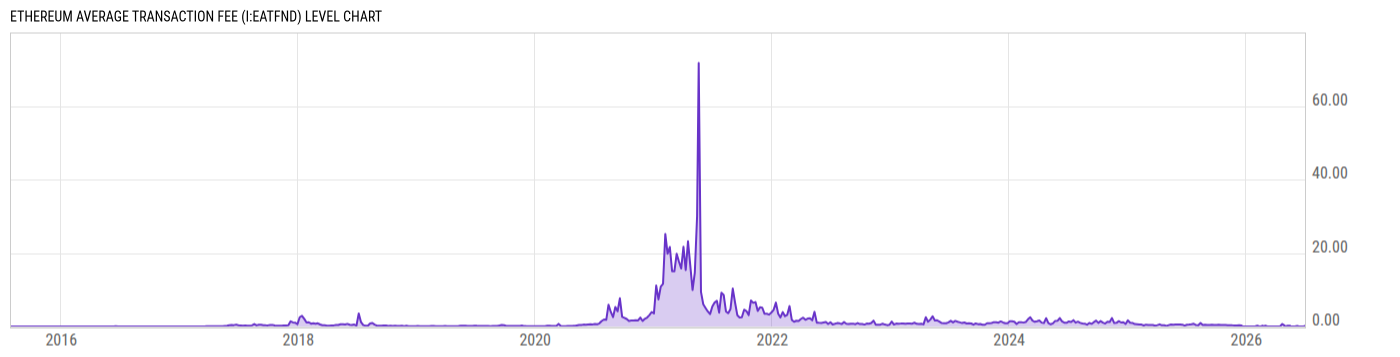
Ethereum Average Transaction Fee is at a current level of 0.00, unchanged from 0.00 yesterday and down from 0.7531 one year ago. This is a change of N/A from yesterday and -100.0% from one year ago. |
|
Ethereum Average Transaction Fee measures the average fee in USD when an Ethereum transaction is processed by a miner and confirmed. Average Ethereum transaction fees can spike during periods of congestion on the network, as they did during the 2017 to early 2018 crypto boom where they reached around 3 USD. |
| Report | Ethereum Statistics |
| Category | Cryptocurrency |
| Region | N/A |
| Source | Etherscan |
Stats
| Last Value | 0.00 |
| Latest Period | Jul 22 2026 |
| Last Updated | Jul 23 2026, 06:38 EDT |
| Average Growth Rate | 2.30K% |
| Value from Yesterday | 0.00 |
| Change from Yesterday | N/A |
| Value from 1 Year Ago | 0.7531 |
| Change from 1 Year Ago | -100.0% |
| Frequency | Daily |
| Unit | USD per Transaction |
| Adjustment | N/A |
| Formula | Ethereum Average Transaction Fee * Ethereum Price |
Historical Data
| Date | Value |
|---|---|
| July 22, 2026 | 0.00 |
| July 21, 2026 | 0.00 |
| July 20, 2026 | 0.00 |
| July 19, 2026 | 0.00 |
| July 18, 2026 | 0.00 |
| July 17, 2026 | 0.00 |
| July 16, 2026 | 0.00 |
| July 15, 2026 | 0.00 |
| July 14, 2026 | 0.00 |
| July 13, 2026 | 0.00 |
| July 12, 2026 | 0.00 |
| July 11, 2026 | 0.00 |
| July 10, 2026 | 0.00 |
| July 09, 2026 | 0.00 |
| July 08, 2026 | 0.177 |
| July 07, 2026 | 0.00 |
| July 06, 2026 | 0.00 |
| July 05, 2026 | 0.00 |
| July 04, 2026 | 0.1756 |
| July 03, 2026 | 0.1698 |
| July 02, 2026 | 0.1608 |
| July 01, 2026 | 0.157 |
| June 30, 2026 | 0.161 |
| June 29, 2026 | 0.1572 |
| June 28, 2026 | 0.1572 |
| Date | Value |
|---|---|
| June 27, 2026 | 0.00 |
| June 26, 2026 | 0.1565 |
| June 25, 2026 | 0.1618 |
| June 24, 2026 | 0.1665 |
| June 23, 2026 | 0.00 |
| June 22, 2026 | 0.00 |
| June 21, 2026 | 0.00 |
| June 20, 2026 | 0.00 |
| June 19, 2026 | 0.171 |
| June 18, 2026 | 0.1748 |
| June 17, 2026 | 0.1791 |
| June 16, 2026 | 0.1794 |
| June 15, 2026 | 0.1725 |
| June 14, 2026 | 0.00 |
| June 13, 2026 | 0.00 |
| June 12, 2026 | 0.00 |
| June 11, 2026 | 0.1621 |
| June 10, 2026 | 0.1638 |
| June 09, 2026 | 0.169 |
| June 08, 2026 | 0.1687 |
| June 07, 2026 | 0.1569 |
| June 06, 2026 | 0.1581 |
| June 05, 2026 | 0.5308 |
| June 04, 2026 | 0.3623 |
| June 03, 2026 | 0.1856 |
News
Basic Info
|
Ethereum Average Transaction Fee is at a current level of 0.00, unchanged from 0.00 yesterday and down from 0.7531 one year ago. This is a change of N/A from yesterday and -100.0% from one year ago. |
|
Ethereum Average Transaction Fee measures the average fee in USD when an Ethereum transaction is processed by a miner and confirmed. Average Ethereum transaction fees can spike during periods of congestion on the network, as they did during the 2017 to early 2018 crypto boom where they reached around 3 USD. |
| Report | Ethereum Statistics |
| Category | Cryptocurrency |
| Region | N/A |
| Source | Etherscan |
Stats
| Last Value | 0.00 |
| Latest Period | Jul 22 2026 |
| Last Updated | Jul 23 2026, 06:38 EDT |
| Average Growth Rate | 2.30K% |
| Value from Yesterday | 0.00 |
| Change from Yesterday | N/A |
| Value from 1 Year Ago | 0.7531 |
| Change from 1 Year Ago | -100.0% |
| Frequency | Daily |
| Unit | USD per Transaction |
| Adjustment | N/A |
| Formula | Ethereum Average Transaction Fee * Ethereum Price |
Related Indicators
| Cryptocurrencies |
| Bitcoin Average Cost Per Transaction | 49.78 USD/tx |
| Bitcoin Cash Price | 219.94 USD |
| Bitcoin Price | 66083.46 USD |
| Bitcoin Transactions Per Day | 505669.0 |
| Ethereum Price | 1933.16 USD |
| Ethereum Transactions Per Day | 2.562M |
| Litecoin Price | 47.00 USD |
| XRP Price | 1.141 USD |