

US Existing Home Sales (I:USEHS)
Level Chart
Basic Info
|
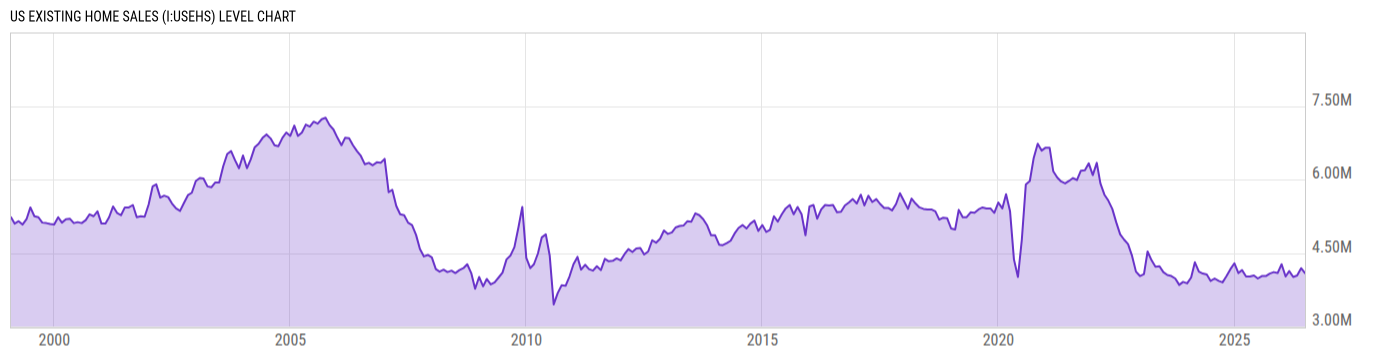
US Existing Home Sales is at a current level of 4.09M, down from 4.19M last month and up from 3.98M one year ago. This is a change of -2.39% from last month and 2.76% from one year ago. |
|
US Existing Home Sales reflects the total unit sales of US homes that are already built. This is a lagging indicator tracking the US housing market, which is impacted by a change in mortgage rates. Historically, US Existing Home Sales declined to a trough of 3.77 million units sold in November 2008 as foreclosures increased and home values fell during the US Housing Crisis. |
| Report | Existing-Home Sales |
| Category | House Sales |
| Region | United States |
| Source | National Association of Realtors |
Stats
| Last Value | 4.09M |
| Latest Period | Jun 2026 |
| Last Updated | Jul 10 2026, 11:05 EDT |
| Next Release | Aug 11 2026, 10:00 EDT |
| Average Growth Rate | 0.12% |
| Value from Last Month | 4.19M |
| Change from Last Month | -2.39% |
| Value from 1 Year Ago | 3.98M |
| Change from 1 Year Ago | 2.76% |
| Frequency | Monthly |
| Adjustment | Seasonally Adjusted Annual Rate |
| Download Source File | |
| Notes | Seasonally adjusted annual rate of U.S. existing home sales. |
Historical Data
| Date | Value |
|---|---|
| June 30, 2026 | 4.09M |
| May 31, 2026 | 4.19M |
| April 30, 2026 | 4.04M |
| March 31, 2026 | 4.01M |
| February 28, 2026 | 4.13M |
| January 31, 2026 | 4.02M |
| December 31, 2025 | 4.27M |
| November 30, 2025 | 4.09M |
| October 31, 2025 | 4.11M |
| September 30, 2025 | 4.08M |
| August 31, 2025 | 4.03M |
| July 31, 2025 | 4.03M |
| June 30, 2025 | 3.98M |
| May 31, 2025 | 4.04M |
| April 30, 2025 | 4.02M |
| March 31, 2025 | 4.02M |
| February 28, 2025 | 4.15M |
| January 31, 2025 | 4.09M |
| December 31, 2024 | 4.29M |
| November 30, 2024 | 4.17M |
| October 31, 2024 | 4.03M |
| September 30, 2024 | 3.90M |
| August 31, 2024 | 3.93M |
| July 31, 2024 | 3.98M |
| June 30, 2024 | 3.93M |
| Date | Value |
|---|---|
| May 31, 2024 | 4.06M |
| April 30, 2024 | 4.08M |
| March 31, 2024 | 4.12M |
| February 29, 2024 | 4.31M |
| January 31, 2024 | 4.00M |
| December 31, 2023 | 3.88M |
| November 30, 2023 | 3.91M |
| October 31, 2023 | 3.85M |
| September 30, 2023 | 3.98M |
| August 31, 2023 | 4.03M |
| July 31, 2023 | 4.05M |
| June 30, 2023 | 4.11M |
| May 31, 2023 | 4.23M |
| April 30, 2023 | 4.22M |
| March 31, 2023 | 4.35M |
| February 28, 2023 | 4.53M |
| January 31, 2023 | 4.07M |
| December 31, 2022 | 4.03M |
| November 30, 2022 | 4.12M |
| October 31, 2022 | 4.44M |
| September 30, 2022 | 4.68M |
| August 31, 2022 | 4.77M |
| July 31, 2022 | 4.88M |
| June 30, 2022 | 5.13M |
| May 31, 2022 | 5.40M |
News
Basic Info
|
US Existing Home Sales is at a current level of 4.09M, down from 4.19M last month and up from 3.98M one year ago. This is a change of -2.39% from last month and 2.76% from one year ago. |
|
US Existing Home Sales reflects the total unit sales of US homes that are already built. This is a lagging indicator tracking the US housing market, which is impacted by a change in mortgage rates. Historically, US Existing Home Sales declined to a trough of 3.77 million units sold in November 2008 as foreclosures increased and home values fell during the US Housing Crisis. |
| Report | Existing-Home Sales |
| Category | House Sales |
| Region | United States |
| Source | National Association of Realtors |
Stats
| Last Value | 4.09M |
| Latest Period | Jun 2026 |
| Last Updated | Jul 10 2026, 11:05 EDT |
| Next Release | Aug 11 2026, 10:00 EDT |
| Average Growth Rate | 0.12% |
| Value from Last Month | 4.19M |
| Change from Last Month | -2.39% |
| Value from 1 Year Ago | 3.98M |
| Change from 1 Year Ago | 2.76% |
| Frequency | Monthly |
| Adjustment | Seasonally Adjusted Annual Rate |
| Download Source File | |
| Notes | Seasonally adjusted annual rate of U.S. existing home sales. |
Related Indicators
| US Housing |
| 15 Year Mortgage Rate | 5.96% |
| 30 Year Mortgage Rate | 6.58% |
| US Building Permits MoM | -3.05% |
| US Existing Home Sales MoM | -2.39% |
| US Home Ownership Rate | 65.30% |
| US Home Vacancy Rate | 1.10% |
| US Housing Starts MoM | 19.02% |
| US New Single Family Houses Sold | 628.00K |
| US New Single Family Houses Sold MoM | 1.62% |
| US Pending Home Sales MoM | -5.35% |
| US Pending Home Sales YoY | -0.28% |
| US Rental Vacancy Rate | 7.30% |