

15 Year Mortgage Rate (I:US15YMR)
Level Chart
Basic Info
|
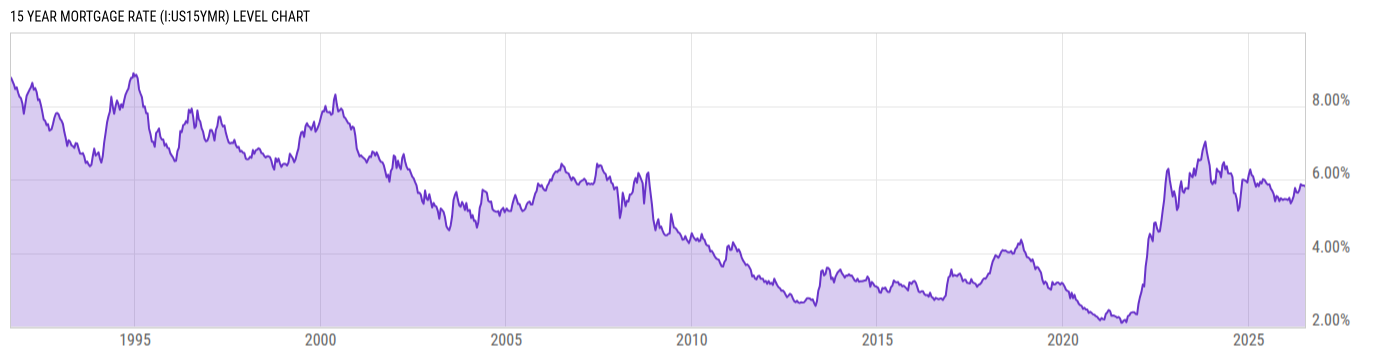
15 Year Mortgage Rate is at 5.82%, compared to 5.79% last week and 5.80% last year. This is higher than the long term average of 5.26%. |
|
The 15 Year Mortgage Rate is the fixed interest rate that US home-buyers would pay if they were to take out a loan lasting 15 years. There are many different kinds of mortgages that homeowners can decide on which will have varying interest rates and monthly payments. |
| Report | Primary Mortgage Market Survey |
| Category | Interest Rates |
| Region | United States |
| Source | Freddie Mac |
Stats
| Last Value | 5.82% |
| Latest Period | Jul 09 2026 |
| Last Updated | Jul 9 2026, 12:06 EDT |
| Next Release | Jul 16 2026, 12:00 EDT |
| Long Term Average | 5.26% |
| Average Growth Rate | -0.19% |
| Value from Last Week | 5.79% |
| Change from Last Week | 0.52% |
| Value from 1 Year Ago | 5.80% |
| Change from 1 Year Ago | 0.34% |
| Frequency | Weekly |
| Unit | Percent |
| Adjustment | N/A |
| Notes | Average U.S. 15 year mortgage rate. |
Historical Data
| Date | Value |
|---|---|
| July 09, 2026 | 5.82% |
| July 02, 2026 | 5.79% |
| June 25, 2026 | 5.84% |
| June 18, 2026 | 5.81% |
| June 11, 2026 | 5.84% |
| June 04, 2026 | 5.79% |
| May 28, 2026 | 5.87% |
| May 21, 2026 | 5.85% |
| May 14, 2026 | 5.71% |
| May 07, 2026 | 5.72% |
| April 30, 2026 | 5.64% |
| April 23, 2026 | 5.58% |
| April 16, 2026 | 5.65% |
| April 09, 2026 | 5.74% |
| April 02, 2026 | 5.77% |
| March 26, 2026 | 5.75% |
| March 19, 2026 | 5.54% |
| March 12, 2026 | 5.50% |
| March 05, 2026 | 5.43% |
| February 26, 2026 | 5.44% |
| February 19, 2026 | 5.35% |
| February 12, 2026 | 5.44% |
| February 05, 2026 | 5.50% |
| January 29, 2026 | 5.49% |
| January 22, 2026 | 5.44% |
| Date | Value |
|---|---|
| January 15, 2026 | 5.38% |
| January 08, 2026 | 5.46% |
| December 31, 2025 | 5.44% |
| December 24, 2025 | 5.50% |
| December 18, 2025 | 5.47% |
| December 11, 2025 | 5.54% |
| December 04, 2025 | 5.44% |
| November 26, 2025 | 5.51% |
| November 20, 2025 | 5.54% |
| November 13, 2025 | 5.49% |
| November 06, 2025 | 5.50% |
| October 30, 2025 | 5.41% |
| October 23, 2025 | 5.44% |
| October 16, 2025 | 5.52% |
| October 09, 2025 | 5.53% |
| October 02, 2025 | 5.55% |
| September 25, 2025 | 5.49% |
| September 18, 2025 | 5.41% |
| September 11, 2025 | 5.50% |
| September 04, 2025 | 5.60% |
| August 28, 2025 | 5.69% |
| August 21, 2025 | 5.69% |
| August 14, 2025 | 5.71% |
| August 07, 2025 | 5.75% |
| July 31, 2025 | 5.85% |
News
Basic Info
|
15 Year Mortgage Rate is at 5.82%, compared to 5.79% last week and 5.80% last year. This is higher than the long term average of 5.26%. |
|
The 15 Year Mortgage Rate is the fixed interest rate that US home-buyers would pay if they were to take out a loan lasting 15 years. There are many different kinds of mortgages that homeowners can decide on which will have varying interest rates and monthly payments. |
| Report | Primary Mortgage Market Survey |
| Category | Interest Rates |
| Region | United States |
| Source | Freddie Mac |
Stats
| Last Value | 5.82% |
| Latest Period | Jul 09 2026 |
| Last Updated | Jul 9 2026, 12:06 EDT |
| Next Release | Jul 16 2026, 12:00 EDT |
| Long Term Average | 5.26% |
| Average Growth Rate | -0.19% |
| Value from Last Week | 5.79% |
| Change from Last Week | 0.52% |
| Value from 1 Year Ago | 5.80% |
| Change from 1 Year Ago | 0.34% |
| Frequency | Weekly |
| Unit | Percent |
| Adjustment | N/A |
| Notes | Average U.S. 15 year mortgage rate. |
Related Indicators
| US Housing |
| 30 Year Mortgage Rate | 6.49% |
| US Building Permits MoM | -0.70% |
| US Existing Home Sales MoM | -2.39% |
| US Home Ownership Rate | 65.30% |
| US Home Vacancy Rate | 1.10% |
| US Housing Starts MoM | -15.45% |
| US New Single Family Houses Sold | 580.00K |
| US New Single Family Houses Sold MoM | -7.35% |
| US Pending Home Sales MoM | 3.78% |
| US Pending Home Sales YoY | 4.77% |
| US Rental Vacancy Rate | 7.30% |