

ADP Nonfarm Payrolls (DISCONTINUED) (I:ADPTNP)
Level Chart
Basic Info
|
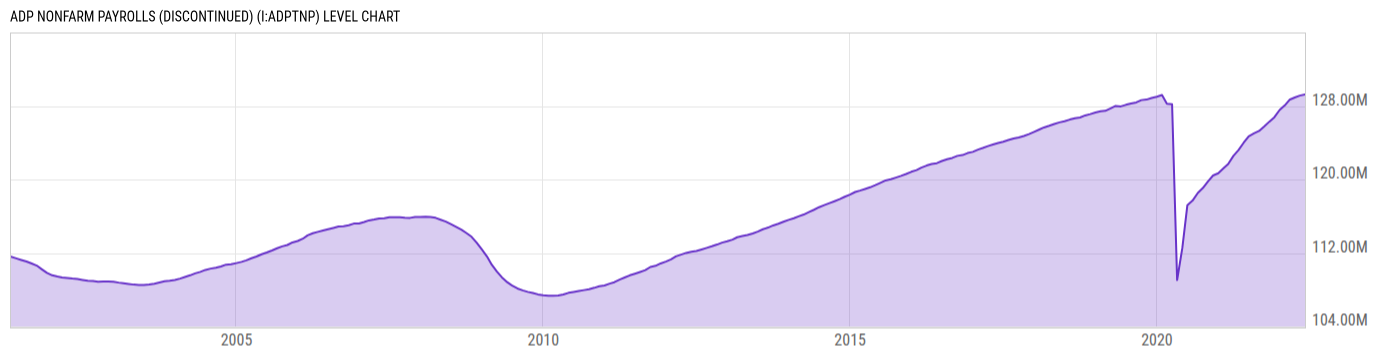
ADP Nonfarm Payrolls is at a current level of 129.26M, up from 129.13M last month and up from 124.00M one year ago. This is a change of 0.10% from last month and 4.24% from one year ago. |
|
ADP Nonfarm Payrolls, is a measure of non-farm private sector employment which is obtained by utilizing an anonymous subset of roughly 400,000 U.S. businesses which are clients of ADP. Typically, an increase in employment fuels growth in the American economy while a decrease in employment slows growth. Nonfarm Payrolls reached a peak in January 2008, and a hit a trough in February 2010 as a result of the Great Recession. |
| Report | ADP Employment Report |
| Category | Employment |
| Region | United States |
| Source | ADP |
Stats
| Last Value | 129.26M |
| Latest Period | May 2022 |
| Last Updated | Jun 2 2022, 08:18 EDT |
| Average Growth Rate | 0.77% |
| Value from Last Month | 129.13M |
| Change from Last Month | 0.10% |
| Value from 1 Year Ago | 124.00M |
| Change from 1 Year Ago | 4.24% |
| Frequency | Monthly |
| Adjustment | Seasonally Adjusted |
| Download Source File | |
| Notes | U.S. private payrolls; based on sample of roughly 0.5M U.S. businesses. |
Historical Data
| Date | Value |
|---|---|
| May 31, 2022 | 129.26M |
| April 30, 2022 | 129.13M |
| March 31, 2022 | 128.93M |
| February 28, 2022 | 128.68M |
| January 31, 2022 | 128.08M |
| December 31, 2021 | 127.56M |
| November 30, 2021 | 126.78M |
| October 31, 2021 | 126.30M |
| September 30, 2021 | 125.77M |
| August 31, 2021 | 125.29M |
| July 31, 2021 | 125.01M |
| June 30, 2021 | 124.70M |
| May 31, 2021 | 124.00M |
| April 30, 2021 | 123.19M |
| March 31, 2021 | 122.57M |
| February 28, 2021 | 121.68M |
| January 31, 2021 | 121.22M |
| December 31, 2020 | 120.68M |
| November 30, 2020 | 120.43M |
| October 31, 2020 | 119.80M |
| September 30, 2020 | 119.07M |
| August 31, 2020 | 118.53M |
| July 31, 2020 | 117.71M |
| June 30, 2020 | 117.20M |
| May 31, 2020 | 112.55M |
| Date | Value |
|---|---|
| April 30, 2020 | 109.05M |
| March 31, 2020 | 128.18M |
| February 29, 2020 | 128.25M |
| January 31, 2020 | 129.19M |
| December 31, 2019 | 129.01M |
| November 30, 2019 | 128.87M |
| October 31, 2019 | 128.70M |
| September 30, 2019 | 128.64M |
| August 31, 2019 | 128.39M |
| July 31, 2019 | 128.28M |
| June 30, 2019 | 128.13M |
| May 31, 2019 | 127.96M |
| April 30, 2019 | 128.01M |
| March 31, 2019 | 127.74M |
| February 28, 2019 | 127.47M |
| January 31, 2019 | 127.44M |
| December 31, 2018 | 127.29M |
| November 30, 2018 | 127.11M |
| October 31, 2018 | 126.97M |
| September 30, 2018 | 126.75M |
| August 31, 2018 | 126.67M |
| July 31, 2018 | 126.52M |
| June 30, 2018 | 126.34M |
| May 31, 2018 | 126.22M |
| April 30, 2018 | 126.05M |
News
Basic Info
|
ADP Nonfarm Payrolls is at a current level of 129.26M, up from 129.13M last month and up from 124.00M one year ago. This is a change of 0.10% from last month and 4.24% from one year ago. |
|
ADP Nonfarm Payrolls, is a measure of non-farm private sector employment which is obtained by utilizing an anonymous subset of roughly 400,000 U.S. businesses which are clients of ADP. Typically, an increase in employment fuels growth in the American economy while a decrease in employment slows growth. Nonfarm Payrolls reached a peak in January 2008, and a hit a trough in February 2010 as a result of the Great Recession. |
| Report | ADP Employment Report |
| Category | Employment |
| Region | United States |
| Source | ADP |
Stats
| Last Value | 129.26M |
| Latest Period | May 2022 |
| Last Updated | Jun 2 2022, 08:18 EDT |
| Average Growth Rate | 0.77% |
| Value from Last Month | 129.13M |
| Change from Last Month | 0.10% |
| Value from 1 Year Ago | 124.00M |
| Change from 1 Year Ago | 4.24% |
| Frequency | Monthly |
| Adjustment | Seasonally Adjusted |
| Download Source File | |
| Notes | U.S. private payrolls; based on sample of roughly 0.5M U.S. businesses. |
Related Indicators
| US Economy |
| ADP Employment Change | 98000.00 |
| Effective Federal Funds Rate | 3.63% |
| US Durable Goods New Orders MoM | -4.48% |
| US Housing Starts MoM | 19.02% |
| US Imports MoM | 3.27% |
| US Index of Consumer Sentiment | 54.40 |
| US Inflation Rate | 3.50% |
| US Initial Claims for Unemployment Insurance | 208000.0 |
| US ISM Manufacturing PMI | 53.30 |
| US Real GDP QoQ | 2.10% |
| US Retail and Food Services Sales MoM | 0.22% |
| US Unemployment Rate | 4.20% |