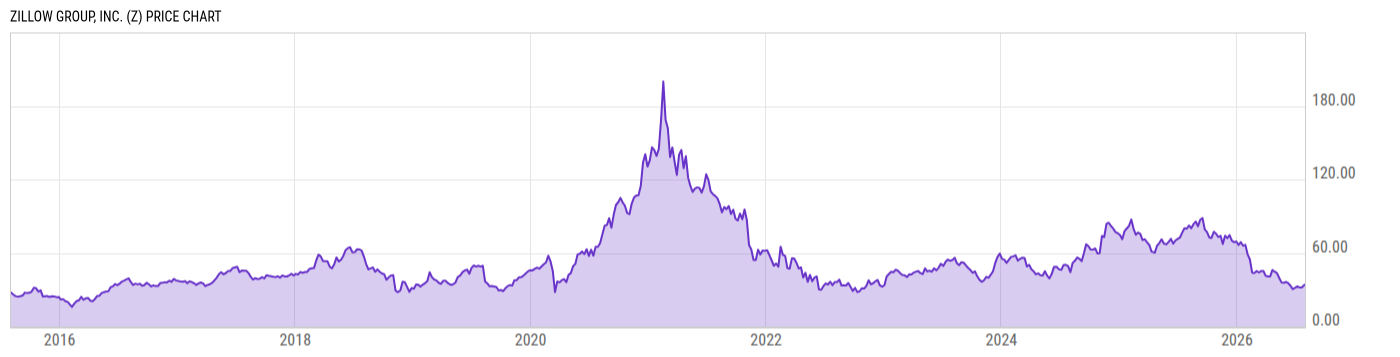
Zillow Group Inc (Z)
46.15
-1.00 (-2.12%)
USD |
NASDAQ |
Feb 03, 16:00
46.17
+0.02 (+0.04%)
After-Hours: 19:59
Price Chart
Key Stats
Price and Performance | |
---|---|
Market Cap | 11.13B |
52 Week High (Daily) | Upgrade |
52 Week Low (Daily) | Upgrade |
All-Time High (Daily) | Upgrade |
Year to Date Total Returns (Daily) | Upgrade |
1 Month Total Returns (Daily) | Upgrade |
1 Year Total Returns (Daily) | -2.90% |
Valuation | |
PE Ratio | -- |
PE Ratio (Forward) | Upgrade |
PS Ratio | 0.9299 |
Price to Book Value | 2.422 |
EV to EBITDA | Upgrade |
Dividend | |
---|---|
Dividend | -- |
Dividend Yield (Forward) | Upgrade |
Financials | |
Revenue (5 Year Growth) | Upgrade |
Revenue (Quarterly YoY Growth) | Upgrade |
EPS Diluted (5 Year Growth) | Upgrade |
EPS Diluted (Quarterly YoY Growth) | Upgrade |
Debt to Equity Ratio | 0.3708 |
Return on Equity | Upgrade |
Return on Assets | Upgrade |
Risk | |
Beta (5Y) | Upgrade |
Max Drawdown (5Y) | 86.51% |
News
Headline
Wire
Time (ET)
Yahoo
02/02 14:54
PR Newswire
01/31 08:00
Yahoo
01/27 02:01
Events
DATE | TIME | TYPE | PERIOD | REPORTED EPS |
ESTIMATED EPS |
SURPRISE | |
02/15/2023 | 17:00 EST | Earnings Call | Q4 2022 | -- | -- | -- | |
02/15/2023 | -- | Results | Q4 2022 | -- | 0.15 | -- | |
11/02/2022 | 17:00 EST | Earnings Call | Q3 2022 | -- | -- | -- | |
11/02/2022 | -- | Results | Q3 2022 | -- | 0.13 | -- | |
08/04/2022 | 17:00 EST | Earnings Call | Q2 2022 | -- | -- | -- | |
08/04/2022 | -- | Results | Q2 2022 | 0.47 | 0.08 | 526.7% | |
05/05/2022 | 17:00 EST | Earnings Call | Q1 2022 | -- | -- | -- | |
05/05/2022 | -- | Results | Q1 2022 | 0.60 | 0.35 | 70.09% |
*Estimated Date/Time
Earnings
Profile
Edit
Zillow Group is an Internet-based real estate company that has historically focused on deriving ad revenue from third-party brokers on online marketplaces such as Zillow.com, Trulia, and HotPads. More recently it has shifted its focus to iBuying via the Zillow Offers platform. |
URL | https://www.zillowgroup.com |
Investor Relations URL | https://investors.zillowgroup.com |
HQ State/Province | Washington |
Sector | Communication Services |
Industry | Internet Content & Information |
Equity Style | Mid Cap/Growth |
Next Earnings Release | Feb. 15, 2023 |
Last Earnings Release | Nov. 02, 2022 |
Next Ex-Dividend Date | N/A |
Last Ex-Dividend Date | N/A |
Analyst Coverage
Consensus Rating
|
|
Analyst Recommendation
|
Source: S&P Global
Dividends
Dividend Per Share (TTM) | -- |
2017
2018
2019
2020
2021
6.00%
4.00%
2.00%
|
|
Yield to Market | 0.00 |
Yield to Sector | 0.00 |
Yield to Industry | 0.00 |
Last Dividend Amt. | -- |
Dividend Frequency | -- |
Last Ex-Dividend Date | -- |
Yield (TTM) | 0.00% |
Forward Yield | -- |
Payout Ratio | 0.00% |
Cash Payout Ratio | 0.00% |
Consistent Payer (5Y) | No |
Consistent Growth (5Y) | No |
Risk Info
Total Returns Comparison
Annual Total Returns Versus Peers
As of February 03, 2023.
Fundamentals
Revenue (TTM) | 12.30B |
Total Expenses (TTM) | 12.70B |
Net Income (TTM) | -289.78M |
Total Assets (Quarterly) | 6.718B |
Total Liabilities (Quarterly) | 2.123B |
Shareholders Equity (Quarterly) | 4.595B |
Cash from Operations (TTM) | 4.205B |
Cash from Investing (TTM) | -655.72M |
Cash from Financing (TTM) | -4.100B |
Ratings
Profile
Edit
Zillow Group is an Internet-based real estate company that has historically focused on deriving ad revenue from third-party brokers on online marketplaces such as Zillow.com, Trulia, and HotPads. More recently it has shifted its focus to iBuying via the Zillow Offers platform. |
URL | https://www.zillowgroup.com |
Investor Relations URL | https://investors.zillowgroup.com |
HQ State/Province | Washington |
Sector | Communication Services |
Industry | Internet Content & Information |
Equity Style | Mid Cap/Growth |
Next Earnings Release | Feb. 15, 2023 |
Last Earnings Release | Nov. 02, 2022 |
Next Ex-Dividend Date | N/A |
Last Ex-Dividend Date | N/A |
Risk Info
Ownership
Insider Ownership Percentage | Upgrade |
Jul '20
Nov '20
Mar '21
80.00%
40.00%
10.00%
Analyst Coverage
Consensus Rating
|
|
Analyst Recommendation
|
Source: S&P Global
Top Fund Holders
Symbol | Dollars Invested | % Weight |
---|---|---|
PGF850 | 649388.0 USD | 7.03% |
JAMIX | 2.680M USD | 5.02% |
IFPUX | 51.98M USD | 3.49% |
ZVGIX | 1.945M USD | 2.69% |
COWZ | 248.14M USD | 2.04% |
VZGRX | 7.152M USD | 1.84% |
ZVNBX | 1.373M USD | 1.71% |
GURU | 719911.0 USD | 1.45% |
WTV | 1.566M USD | 1.15% |
XITK | 1.245M USD | 1.11% |
SIZE | 673267.0 USD | 0.20% |
EUSA | 990569.0 USD | 0.19% |
Other Resources
Whale Wisdom | 13F Filings |
Seeking Alpha | Call Transcripts |
Nasdaq | Insider Trading |
Nasdaq | Institutional Ownership |
Nasdaq | Option Chain |
SEC | SEC Filings |
Z Tweets |