

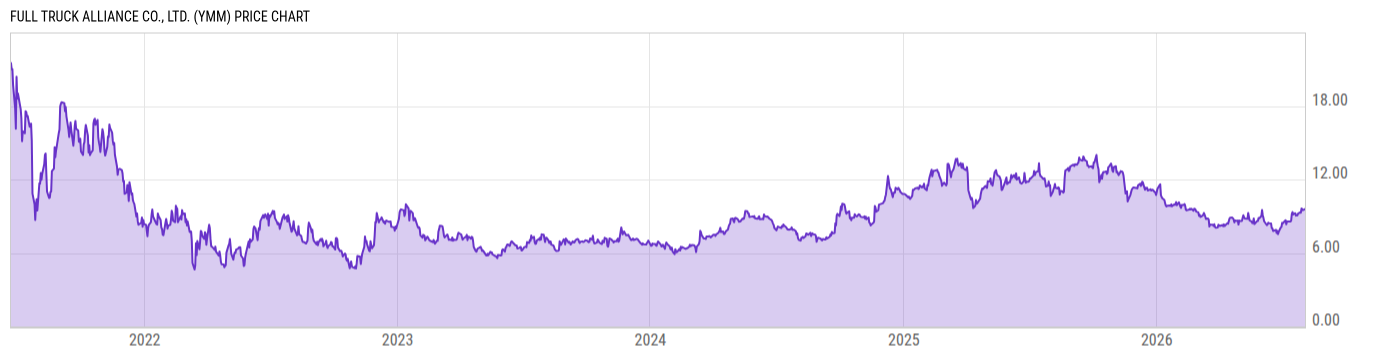
Full Truck Alliance Co., Ltd. (YMM)
9.585
+0.10
(+1.00%)
USD |
NYSE |
Aug 03, 11:50
Price Chart
Key Stats
| Price and Performance | |
|---|---|
| Market Cap | 8.938B |
| 52 Week High (Daily) | |
| 52 Week Low (Daily) | |
| All-Time High (Daily) | |
| Year to Date Total Returns (Daily) | |
| 1 Month Total Returns (Daily) | |
| 1 Year Total Returns (Daily) | -15.49% |
| Valuation | |
| PE Ratio | 17.51 |
| PE Ratio (Forward) | |
| PS Ratio | 5.627 |
| Price to Book Value | 1.721 |
| EV to EBITDA | |
| Dividend | |
|---|---|
| Dividend | 0.084 |
| Dividend Yield (Forward) | |
| Financials | |
| Revenue (5 Year Growth) | |
| Revenue (Quarterly YoY Growth) | |
| EPS Diluted (5 Year Growth) | |
| EPS Diluted (Quarterly YoY Growth) | |
| Debt to Equity Ratio | 0.0006 |
| Return on Equity | |
| Return on Assets | |
| Risk | |
| Beta (5Y) | |
| Max Drawdown (5Y) | 78.37% |
Profile
| Full Truck Alliance Co., Ltd. is a holding company, which engages in comprehensive services for shippers and truckers through its mobile and website platforms. Its platform connects shippers with truckers to facilitate shipments across distance ranges, cargo weights and types. It provides a range of freight matching services, including freight listing, freight brokerage and online transaction services. The company also provides a range of value-added services that cater to the various needs of shippers and truckers, such as financial institutions, highway authorities, and gas station operators. Full Truck Alliance was founded by Hui Zhang on December 27, 2017 and is headquartered in Guiyang, China. |
| URL | http://www.fulltruckalliance.com |
| Investor Relations URL | N/A |
| HQ State/Province | Guizhou |
| Sector | Industrials |
| Industry | Ground Transportation |
| Equity Style | N/A |
| Next Earnings Release | Aug. 20, 2026 (est.) |
| Last Earnings Release | May. 21, 2026 |
| Next Ex-Dividend Date | N/A |
| Last Ex-Dividend Date | Jul. 07, 2026 |