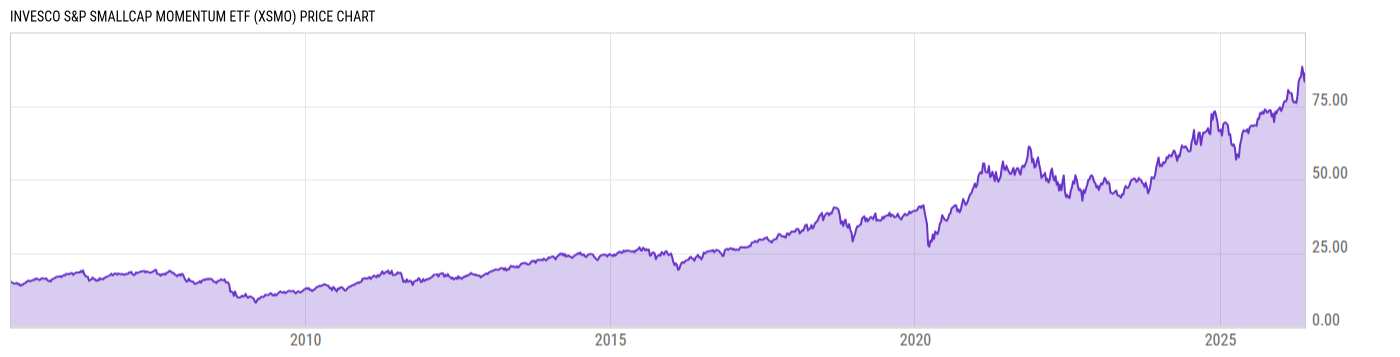
Invesco S&P SmallCap Momentum ETF (XSMO)
50.62
-0.96 (-1.86%)
USD |
Apr 19, 16:58
Price Chart
Key Stats
Customize
Expense Ratio | Discount or Premium to NAV | Total Assets Under Management | 30-Day Average Daily Volume |
---|---|---|---|
0.39% | 0.06% | 171.66M | 15159.80 |
Dividend Yield | Turnover Ratio | 1 Year Fund Level Flows | Max Drawdown (All) |
0.55% | 180.0% | 51.78M | Upgrade |
Basic Info
Investment Strategy | |
The investment seeks to track the investment results (before fees and expenses) of the S&P SmallCap 600 Momentum Index (the "underlying index"). The fund generally will invest at least 90% of its total assets in the securities that comprise the underlying index. Strictly in accordance with its guidelines and mandated procedures, the index provider compiles, maintains and calculates the underlying index, which is composed of constituents of the S&P SmallCap 600® that have the highest "momentum score." |
General | |
Security Type | Exchange-Traded Fund |
Equity Style | Small Cap/Growth |
Fixed Income Style | -- |
Broad Asset Class | US Equity |
Broad Category | Equity |
Category Name | Small Growth |
Category Index | Russell 2000 Growth TR USD |
Prospectus Objective | Growth |
Fund Owner Firm Name | Invesco |
Prospectus Benchmark Index | |
S&P SmallCap 600 Momentum TR USD | 100.0% |
Broad Asset Class Benchmark Index | |
^SPXTR | 100.0% |
Manager Tenure | |
Peter Hubbard | 13.84 yrs |
Michael Jeanette | 12.59 yrs |
Tony Seisser | 6.59 yrs |
Pratik Doshi | 0.59 yrs |
Net Fund Flows Versus Category
1 Month
% Rank:
--
--
Category Low
--
Category High
1 Year
% Rank:
33
51.78M
-1.859B
Category Low
2.200B
Category High
3 Months
% Rank:
--
--
Category Low
--
Category High
3 Years
% Rank:
--
--
Category Low
--
Category High
6 Months
% Rank:
--
--
Category Low
--
Category High
5 Years
% Rank:
--
--
Category Low
--
Category High
YTD
% Rank:
--
--
Category Low
--
Category High
10 Years
% Rank:
--
--
Category Low
--
Category High
As of March 31, 2021
Performance Versus Category
As of April 16, 2021. Returns for periods of 1 year and above are annualized.
Annual Total Returns Versus Peers
Edit comparables
As of April 16, 2021.
Asset Allocation
Top 10 Holdings
Name | % Weight | Price | % Change |
---|---|---|---|
GameStop Corp Class A | 7.23% | 164.10 | 6.08% |
MicroStrategy Inc Class A | 3.77% | 638.00 | -8.02% |
Saia Inc | 2.55% | 240.02 | -1.13% |
Alarm.com Holdings Inc | 1.79% | 92.59 | -2.43% |
NeoGenomics Inc | 1.73% | 47.96 | -2.80% |
Innovative Industrial Properties Inc Registered Shs | 1.72% | 182.16 | -1.50% |
Stamps.com Inc | 1.67% | 199.52 | -3.00% |
Omnicell Inc | 1.65% | 137.83 | -0.01% |
Trupanion Inc | 1.63% | 81.14 | -0.06% |
Power Integrations Inc | 1.57% | 80.43 | -2.76% |
News
Headline
Wire
Time (ET)
PR Newswire
05/26 14:00
Basic Info
Investment Strategy | |
The investment seeks to track the investment results (before fees and expenses) of the S&P SmallCap 600 Momentum Index (the "underlying index"). The fund generally will invest at least 90% of its total assets in the securities that comprise the underlying index. Strictly in accordance with its guidelines and mandated procedures, the index provider compiles, maintains and calculates the underlying index, which is composed of constituents of the S&P SmallCap 600® that have the highest "momentum score." |
General | |
Security Type | Exchange-Traded Fund |
Equity Style | Small Cap/Growth |
Fixed Income Style | -- |
Broad Asset Class | US Equity |
Broad Category | Equity |
Category Name | Small Growth |
Category Index | Russell 2000 Growth TR USD |
Prospectus Objective | Growth |
Fund Owner Firm Name | Invesco |
Prospectus Benchmark Index | |
S&P SmallCap 600 Momentum TR USD | 100.0% |
Broad Asset Class Benchmark Index | |
^SPXTR | 100.0% |
Manager Tenure | |
Peter Hubbard | 13.84 yrs |
Michael Jeanette | 12.59 yrs |
Tony Seisser | 6.59 yrs |
Pratik Doshi | 0.59 yrs |
Fundamentals
General | |
Distribution Yield | Upgrade |
Dividend Yield TTM (4-19-21) | 0.55% |
30-Day SEC Yield (3-31-21) | Upgrade |
7-Day SEC Yield | -- |
Number of Holdings | Upgrade |
Stock | |
Weighted Average PE Ratio | 24.40 |
Weighted Average Price to Sales Ratio | Upgrade |
Weighted Average Price to Book Ratio | Upgrade |
Weighted Median ROE | Upgrade |
Weighted Median ROA | Upgrade |
Forecasted Dividend Yield | Upgrade |
Forecasted PE Ratio | Upgrade |
Forecasted Price to Sales Ratio | Upgrade |
Forecasted Price to Book Ratio | Upgrade |
As of April 18, 2021
Growth Estimates
Fund Details
Key Dates | |
Inception Date | 3/3/2005 |
Last Annual Report Date | 4/30/2020 |
Last Prospectus Date | 8/28/2020 |
Attributes | |
Enhanced Index Fund | No |
Index Fund |
|
Inverse Fund | No |
Leveraged Fund | No |
Fund of Funds | No |
Currency Hedged Fund | No |
Synthetic Replication Fund | No |
Has Dividend Investment Plan | No |
Socially Responsible Fund | No |
News
Headline
Wire
Time (ET)
PR Newswire
05/26 14:00