

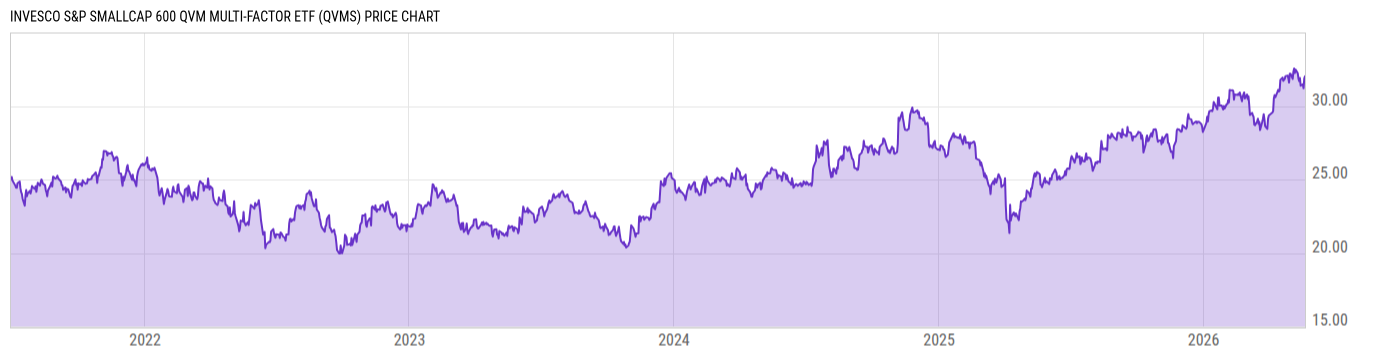
Invesco S&P SmallCap 600 QVM Multi-factor ETF (QVMS)
32.75
+0.03
(+0.10%)
USD |
NYSEARCA |
Jun 09, 15:45
Price Chart
Key Stats
| Net Expense Ratio | Discount or Premium to NAV | Total Assets Under Management | 30-Day Average Daily Volume |
|---|---|---|---|
| 0.15% | 0.11% | 238.53M | 288.50 |
| Weighted Average Dividend Yield | Turnover Ratio (Generic) | 1 Year Fund Level Flows | Max Drawdown (Since Inception) |
| 1.48% | 35.00% | -3.658M |
Basic Info
| Investment Strategy | |
| The Fund seeks to track the investment results of the S&P SmallCap 600 Quality, Value & Momentum Top 90% Multi-Factor Index, which is designed to track the performance of a subset of securities from the S&P SmallCap 600 Index that exhibit the investment style criteria of quality, value and momentum. |
| General | |
| Security Type | Exchange-Traded Fund |
| Equity Style | Small Cap Core |
| Broad Asset Class | US Equity |
| Broad Category | Equity |
| Global Peer Group | Equity US Sm&Mid Cap |
| Peer Group | Small-Cap Core Funds |
| Global Macro | Equity North America |
| US Macro | Small-Cap Funds |
| YCharts Categorization | -- |
| YCharts Benchmark | -- |
| Prospectus Objective | Small-Cap Funds |
| Fund Owner Firm Name | Invesco |
| Broad Asset Class Benchmark Index | |
| ^SPXTR | 100.0% |
Performance Versus Peer Group
Annual Total Returns Versus Peers
As of June 09, 2026.
Asset Allocation
As of May 31, 2026.
| Type | % Net |
|---|---|
| Cash | -0.01% |
| Stock | 100.1% |
| Bond | 0.00% |
| Convertible | 0.00% |
| Preferred | 0.00% |
| Other | -0.13% |
Basic Info
| Investment Strategy | |
| The Fund seeks to track the investment results of the S&P SmallCap 600 Quality, Value & Momentum Top 90% Multi-Factor Index, which is designed to track the performance of a subset of securities from the S&P SmallCap 600 Index that exhibit the investment style criteria of quality, value and momentum. |
| General | |
| Security Type | Exchange-Traded Fund |
| Equity Style | Small Cap Core |
| Broad Asset Class | US Equity |
| Broad Category | Equity |
| Global Peer Group | Equity US Sm&Mid Cap |
| Peer Group | Small-Cap Core Funds |
| Global Macro | Equity North America |
| US Macro | Small-Cap Funds |
| YCharts Categorization | -- |
| YCharts Benchmark | -- |
| Prospectus Objective | Small-Cap Funds |
| Fund Owner Firm Name | Invesco |
| Broad Asset Class Benchmark Index | |
| ^SPXTR | 100.0% |