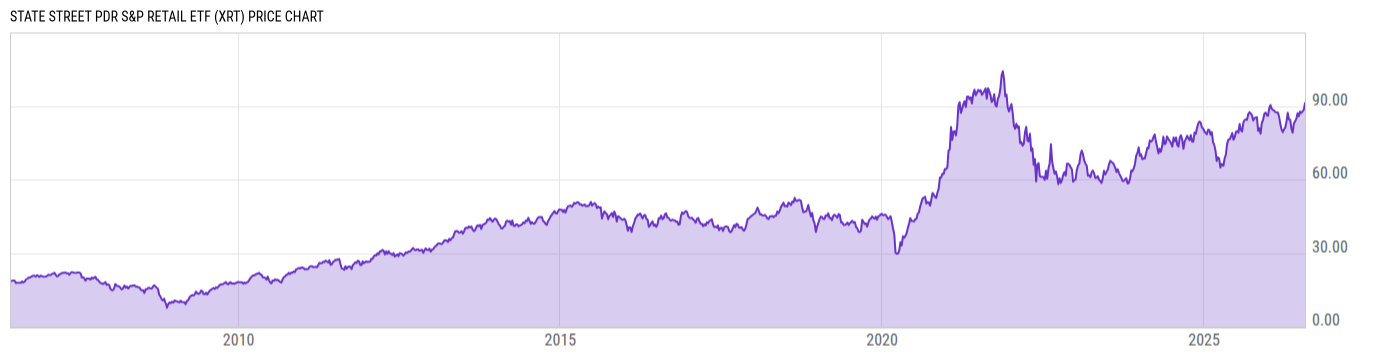
Key Stats

Expense Ratio Discount or Premium to NAV Total Assets Under Management 30-Day Average Daily Volume
0.35% -0.03% 431.38M 7.538M
Dividend Yield Turnover Ratio 1 Year Fund Level Flows Max Drawdown (All)
2.22% 39.00% -14.43M Upgrade

Basic Info

Investment Strategy
The investment seeks to provide investment results that, before fees and expenses, correspond generally to the total return performance of an index derived from the retail segment of a U.S. total market composite index. In seeking to track the performance of the S&P Retail Select Industry Index (the "index"), the fund employs a sampling strategy. It generally invests substantially all, but at least 80%, of its total assets in the securities comprising the index. The index represents the retail segment of the S&P Total Market Index ("S&P TMI").
General
Security Type Exchange-Traded Fund
Equity Style Small Cap/Value
Fixed Income Style --
Broad Asset Class Sector Equity
Broad Category Equity
Category Name Consumer Cyclical
Category Index S&P 1500 Cons Discretionary TR
Global Category Name Consumer Goods & Services Sector Equity
YCharts Categorization Consumer Services Equity
YCharts Benchmark S&P 1500 Consumer Staples (Sector) Total Return (^SP15CNSSTR)
Prospectus Objective Specialty - Unaligned
Fund Owner Firm Name SPDR State Street Global Advisors
Prospectus Benchmark Index
S&P Retail Select Industry TR USD 100.0%
Broad Asset Class Benchmark Index
^MSWNTR 100.0%
Manager Tenure
Michael Feehily 11.34 yrs
Karl Schneider 8.34 yrs
Ted Janowsky 6.16 yrs

Net Fund Flows Versus Category

View Net Fund Flows. Upgrade now.
1M
3M
6M
YTD
1Y
3Y
5Y
10Y
 
80.00B
60.00B
40.00B
20.00B
0
-20.00B
1 Month
% Rank: --
-- Category Low
-- Category High
1 Year
% Rank: 50
-14.43M
-2.055B Category Low
186.13M Category High
3 Months
% Rank: --
-- Category Low
-- Category High
3 Years
% Rank: --
-- Category Low
-- Category High
6 Months
% Rank: --
-- Category Low
-- Category High
5 Years
% Rank: --
-- Category Low
-- Category High
YTD
% Rank: --
-- Category Low
-- Category High
10 Years
% Rank: --
-- Category Low
-- Category High
As of February 28, 2023

Performance Versus Category

 
20%
15%
10%
5%
0
View Category Returns. Upgrade now.
Name
1M
3M
YTD
1Y
3Y
5Y
10Y
15Y
Total Return (Price)
--
--
--
--
--
--
--
--
Total Return (NAV)
--
--
--
--
--
--
--
--
Category Rtn. (NAV)
--
--
--
--
--
--
--
--
% Rank in Cat (NAV)
--
--
--
--
--
--
--
--
As of March 31, 2023. Returns for periods of 1 year and above are annualized.

Annual Total Returns Versus Peers

Loading chart...
Name
2016
2017
2018
2019
2020
2021
2022
YTD
3.31%
4.21%
-8.03%
14.12%
41.94%
42.63%
-31.64%
5.27%
7.51%
22.40%
-8.71%
27.67%
15.90%
21.82%
-18.14%
7.73%
15.16%
18.15%
-9.28%
17.49%
29.07%
37.36%
-28.05%
12.84%
9.68%
11.21%
-9.30%
13.82%
-10.29%
22.79%
-25.37%
12.16%
5.63%
15.04%
-8.78%
25.88%
11.46%
28.76%
-24.03%
8.93%
3.11%
22.94%
-6.31%
26.77%
24.46%
16.33%
-29.08%
15.23%
As of March 31, 2023.

Fundamentals

General
Distribution Yield Upgrade
Dividend Yield TTM (3-31-23) 2.22%
30-Day SEC Yield (3-29-23) Upgrade
7-Day SEC Yield --
Number of Holdings Upgrade
Stock
Weighted Average PE Ratio 11.68
Weighted Average Price to Sales Ratio Upgrade
Weighted Average Price to Book Ratio Upgrade
Weighted Median ROE Upgrade
Weighted Median ROA Upgrade
Forecasted Dividend Yield Upgrade
Forecasted PE Ratio Upgrade
Forecasted Price to Sales Ratio Upgrade
Forecasted Price to Book Ratio Upgrade
As of March 29, 2023

Growth Estimates

Forecasted 5 Yr Earnings Growth Upgrade
Forecasted Book Value Growth Upgrade
Forecasted Cash Flow Growth Upgrade
Forecasted Earnings Growth Upgrade
Forecasted Revenue Growth Upgrade
As of March 29, 2023

Asset Allocation

As of March 29, 2023.
Type % Net % Long % Short
Cash 0.12% Upgrade Upgrade
Stock 99.88% Upgrade Upgrade
Bond 0.00% Upgrade Upgrade
Convertible 0.00% Upgrade Upgrade
Preferred 0.00% Upgrade Upgrade
Other 0.00% Upgrade Upgrade

Top 10 Holdings

Name % Weight Price % Change
GameStop Corp Class A 1.67% 23.02 2.31%
Amazon.com Inc 1.42% 103.29 1.26%
Carvana Co Class A 1.38% 9.79 10.87%
Signet Jewelers Ltd 1.36% 77.78 3.29%
Grocery Outlet Holding Corp 1.36% 28.27 0.07%
Ollie's Bargain Outlet Holdings Inc 1.36% 57.95 2.49%
Walmart Inc 1.35% 147.45 1.22%
Academy Sports and Outdoors Inc Ordinary Shares 1.35% 65.25 3.82%
Revolve Group Inc Class A 1.35% 26.30 2.61%
Costco Wholesale Corp 1.34% 496.87 1.10%

Basic Info

Investment Strategy
The investment seeks to provide investment results that, before fees and expenses, correspond generally to the total return performance of an index derived from the retail segment of a U.S. total market composite index. In seeking to track the performance of the S&P Retail Select Industry Index (the "index"), the fund employs a sampling strategy. It generally invests substantially all, but at least 80%, of its total assets in the securities comprising the index. The index represents the retail segment of the S&P Total Market Index ("S&P TMI").
General
Security Type Exchange-Traded Fund
Equity Style Small Cap/Value
Fixed Income Style --
Broad Asset Class Sector Equity
Broad Category Equity
Category Name Consumer Cyclical
Category Index S&P 1500 Cons Discretionary TR
Global Category Name Consumer Goods & Services Sector Equity
YCharts Categorization Consumer Services Equity
YCharts Benchmark S&P 1500 Consumer Staples (Sector) Total Return (^SP15CNSSTR)
Prospectus Objective Specialty - Unaligned
Fund Owner Firm Name SPDR State Street Global Advisors
Prospectus Benchmark Index
S&P Retail Select Industry TR USD 100.0%
Broad Asset Class Benchmark Index
^MSWNTR 100.0%
Manager Tenure
Michael Feehily 11.34 yrs
Karl Schneider 8.34 yrs
Ted Janowsky 6.16 yrs

Fundamentals

General
Distribution Yield Upgrade
Dividend Yield TTM (3-31-23) 2.22%
30-Day SEC Yield (3-29-23) Upgrade
7-Day SEC Yield --
Number of Holdings Upgrade
Stock
Weighted Average PE Ratio 11.68
Weighted Average Price to Sales Ratio Upgrade
Weighted Average Price to Book Ratio Upgrade
Weighted Median ROE Upgrade
Weighted Median ROA Upgrade
Forecasted Dividend Yield Upgrade
Forecasted PE Ratio Upgrade
Forecasted Price to Sales Ratio Upgrade
Forecasted Price to Book Ratio Upgrade
As of March 29, 2023

Growth Estimates

Forecasted 5 Yr Earnings Growth Upgrade
Forecasted Book Value Growth Upgrade
Forecasted Cash Flow Growth Upgrade
Forecasted Earnings Growth Upgrade
Forecasted Revenue Growth Upgrade
As of March 29, 2023

Fund Details

Key Dates
Inception Date 6/19/2006
Last Annual Report Date 6/30/2022
Last Prospectus Date 10/31/2022
Attributes
Index Fund Yes
Inverse Fund No
Leveraged Fund No
Fund of Funds No
Currency Hedged Fund No
Synthetic Replication Fund No
Has Dividend Investment Plan No
Socially Responsible Fund No

Top Portfolio Holders

0 of 0