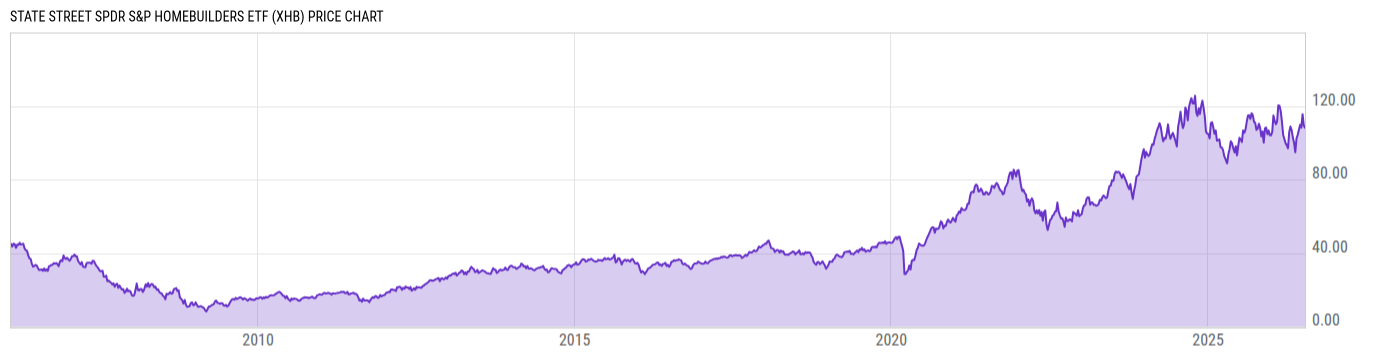
SPDR® S&P Homebuilders ETF (XHB)
63.56
+0.39 (+0.62%)
USD |
Jan 22, 20:00
Price Chart
Key Stats
Customize
Expense Ratio | Discount or Premium to NAV | Total Assets Under Management | 30-Day Average Daily Volume |
---|---|---|---|
0.35% | -0.02% | 1.468B | 1.967M |
Dividend Yield | Turnover Ratio | 1 Year Fund Level Flows | Max Drawdown (All) |
0.66% | 27.00% | 325.22M | Upgrade |
Basic Info
Investment Strategy | |
The investment seeks to provide investment results that, before fees and expenses, correspond generally to the total return performance of an index derived from the homebuilding segment of a U.S. total market composite index. In seeking to track the performance of the S&P Homebuilders Select Industry Index (the "index"), the fund employs a sampling strategy. It generally invests substantially all, but at least 80%, of its total assets in the securities comprising the index. The index represents the homebuilders segment of the S&P Total Market Index ("S&P TMI"). |
General | |
Security Type | Exchange-Traded Fund |
Equity Style | Mid Cap/Blend |
Fixed Income Style | -- |
Broad Asset Class | Sector Equity |
Broad Category | Equity |
Category Name | Consumer Cyclical |
Category Index | S&P 1500 Cons Discretionary TR |
Prospectus Objective | Specialty - Real Estate |
Fund Owner Firm Name | SPDR State Street Global Advisors |
Prospectus Benchmark Index | |
S&P Homebuilders Select Industry TR USD | 100.0% |
Broad Asset Class Benchmark Index | |
^MSWNTR | 100.0% |
Manager Tenure | |
Michael Feehily | 9.18 yrs |
Karl Schneider | 6.18 yrs |
Raymond Donofrio | 4.00 yrs |
Net Fund Flows Versus Category
1 Month
% Rank:
--
--
Category Low
--
Category High
1 Year
% Rank:
20
325.22M
-282.24M
Category Low
794.76M
Category High
3 Months
% Rank:
--
--
Category Low
--
Category High
3 Years
% Rank:
--
--
Category Low
--
Category High
6 Months
% Rank:
--
--
Category Low
--
Category High
5 Years
% Rank:
--
--
Category Low
--
Category High
YTD
% Rank:
--
--
Category Low
--
Category High
10 Years
% Rank:
--
--
Category Low
--
Category High
As of December 31, 2020
Performance Versus Category
As of January 21, 2021. Returns for periods of 1 year and above are annualized.
Annual Total Returns Versus Peers
Edit comparables
As of January 22, 2021.
Asset Allocation
Top 10 Holdings
Name | % Weight | Price | % Change |
---|---|---|---|
Williams-Sonoma Inc | 4.50% | 132.32 | 4.43% |
RH | 4.36% | 502.02 | 0.16% |
Lennar Corp | 4.28% | 84.62 | 1.22% |
Johnson Controls International PLC | 4.27% | 52.35 | 0.36% |
PulteGroup Inc | 4.19% | 48.89 | 2.80% |
Trane Technologies PLC | 4.11% | 152.67 | -1.15% |
D.R. Horton Inc | 4.08% | 77.71 | 1.49% |
Lowe's Companies Inc | 4.07% | 172.40 | 0.03% |
Carrier Global Corp Ordinary Shares | 3.99% | 39.51 | -0.58% |
Masco Corp | 3.98% | 57.52 | -0.86% |
News
Headline
Wire
Time (ET)
SA Breaking News
12/31 10:50
SA Breaking News
12/29 12:38
SA Breaking News
12/17 14:44
Basic Info
Investment Strategy | |
The investment seeks to provide investment results that, before fees and expenses, correspond generally to the total return performance of an index derived from the homebuilding segment of a U.S. total market composite index. In seeking to track the performance of the S&P Homebuilders Select Industry Index (the "index"), the fund employs a sampling strategy. It generally invests substantially all, but at least 80%, of its total assets in the securities comprising the index. The index represents the homebuilders segment of the S&P Total Market Index ("S&P TMI"). |
General | |
Security Type | Exchange-Traded Fund |
Equity Style | Mid Cap/Blend |
Fixed Income Style | -- |
Broad Asset Class | Sector Equity |
Broad Category | Equity |
Category Name | Consumer Cyclical |
Category Index | S&P 1500 Cons Discretionary TR |
Prospectus Objective | Specialty - Real Estate |
Fund Owner Firm Name | SPDR State Street Global Advisors |
Prospectus Benchmark Index | |
S&P Homebuilders Select Industry TR USD | 100.0% |
Broad Asset Class Benchmark Index | |
^MSWNTR | 100.0% |
Manager Tenure | |
Michael Feehily | 9.18 yrs |
Karl Schneider | 6.18 yrs |
Raymond Donofrio | 4.00 yrs |
Fundamentals
General | |
Distribution Yield | Upgrade |
Dividend Yield TTM (1-22-21) | 0.66% |
30-Day SEC Yield (1-22-21) | Upgrade |
7-Day SEC Yield | -- |
Number of Holdings | Upgrade |
Stock | |
Weighted Average PE Ratio | 18.71 |
Weighted Average Price to Sales Ratio | Upgrade |
Weighted Average Price to Book Ratio | Upgrade |
Weighted Median ROE | Upgrade |
Weighted Median ROA | Upgrade |
Forecasted Dividend Yield | Upgrade |
Forecasted PE Ratio | Upgrade |
Forecasted Price to Sales Ratio | Upgrade |
Forecasted Price to Book Ratio | Upgrade |
As of January 21, 2021
Growth Estimates
Fund Details
Key Dates | |
Inception Date | 1/31/2006 |
Last Annual Report Date | 6/30/2020 |
Last Prospectus Date | 10/31/2020 |
Attributes | |
Enhanced Index Fund | No |
Index Fund |
|
Inverse Fund | No |
Leveraged Fund | No |
Fund of Funds | No |
Currency Hedged Fund | No |
Synthetic Replication Fund | No |
Has Dividend Investment Plan |
|
Socially Responsible Fund | No |
News
Headline
Wire
Time (ET)
SA Breaking News
12/31 10:50
SA Breaking News
12/29 12:38
SA Breaking News
12/17 14:44