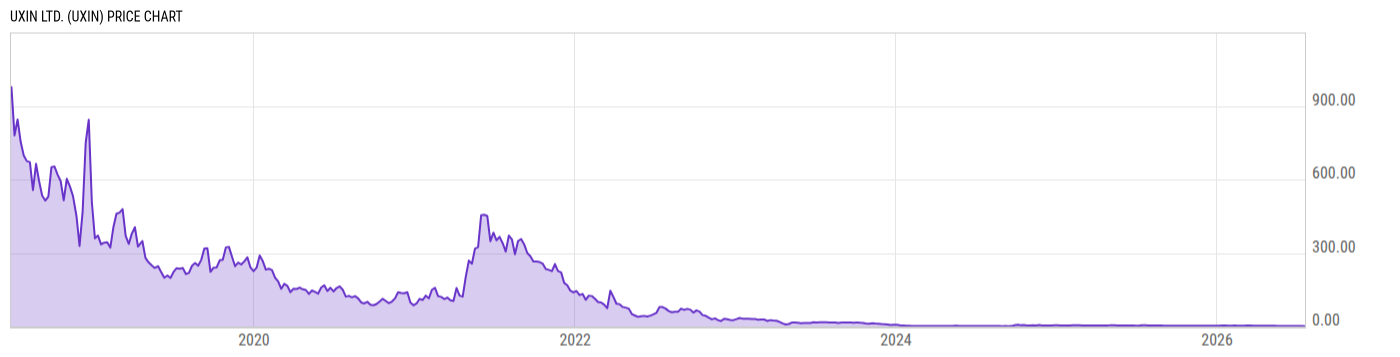
Uxin Ltd (UXIN)
2.50
-0.05
(-1.96%)
USD |
NASDAQ |
Mar 24, 16:00
2.48
-0.02
(-0.80%)
After-Hours: 20:00
Key Stats
Price and Performance | |
---|---|
Market Cap | 114.64M |
52 Week High (Daily) | Upgrade |
52 Week Low (Daily) | Upgrade |
All-Time High (Daily) | Upgrade |
Year to Date Total Returns (Daily) | Upgrade |
1 Month Total Returns (Daily) | Upgrade |
1 Year Total Returns (Daily) | -84.08% |
Valuation | |
PE Ratio | -- |
PE Ratio (Forward) | Upgrade |
PS Ratio | 0.3204 |
Price to Book Value | -- |
EV to EBITDA | Upgrade |
Dividend | |
---|---|
Dividend | -- |
Dividend Yield (Forward) | Upgrade |
Financials | |
Revenue (5 Year Growth) | Upgrade |
Revenue (Quarterly YoY Growth) | Upgrade |
EPS Diluted (5 Year Growth) | Upgrade |
EPS Diluted (Quarterly YoY Growth) | Upgrade |
Debt to Equity Ratio | -0.6381 |
Return on Equity | Upgrade |
Return on Assets | Upgrade |
Risk | |
Beta (5Y) | Upgrade |
Max Drawdown (5Y) | -- |
News
Headline
Wire
Time (ET)
Globe Newswire
03/24 06:00
MT Newswires
03/13 10:47
MT Newswires
03/08 10:37
MT Newswires
01/25 10:38
Events
DATE | TIME | TYPE | PERIOD | REPORTED EPS |
ESTIMATED EPS |
SURPRISE | |
03/29/2023* | 08:00 EST | Earnings Call | Q3 2023 | -- | -- | -- | |
03/29/2023* | -- | Results | Q3 2023 | -- | -0.12 | -- | |
12/30/2022 | 08:00 EST | Earnings Call | Q2 2023 | -- | -- | -- | |
12/30/2022 | -- | Results | Q2 2023 | -- | -- | -- | |
09/30/2022 | 08:00 EST | Earnings Call | Q1 2023 | -- | -- | -- | |
09/30/2022 | -- | Results | Q1 2023 | -- | -- | -- | |
07/28/2022 | 08:00 EST | Earnings Call | Q4 2022 | -- | -- | -- | |
07/28/2022 | -- | Results | Q4 2022 | -- | -- | -- |
*Estimated Date/Time
Earnings
Profile
Edit
Uxin Ltd is an investment holding company. Along with its subsidiaries, the firm operates used car e-commerce platforms through its mobile applications and websites. It facilitates used car transaction services and financing solutions offered by third-party financing partners to buyers for their used car purchases. The company generates revenue through sales of the commission of salvage car sales, and interest income from the financial lease. |
URL | https://www.xin.com |
Investor Relations URL | https://ir.xin.com/ |
HQ State/Province | N/A |
Sector | Consumer Cyclical |
Industry | Auto & Truck Dealerships |
Equity Style | N/A |
Next Earnings Release | Mar. 29, 2023 (est.) |
Last Earnings Release | Dec. 30, 2022 |
Next Ex-Dividend Date | N/A |
Last Ex-Dividend Date | N/A |
Analyst Coverage
Consensus Rating
|
|
Analyst Recommendation
|
Source: S&P Global
Dividends
Dividend Per Share (TTM) | -- |
2017
2018
2019
2020
2021
6.00%
4.00%
2.00%
|
|
Yield to Market | 0.00 |
Yield to Sector | 0.00 |
Yield to Industry | 0.00 |
Last Dividend Amt. | -- |
Dividend Frequency | -- |
Last Ex-Dividend Date | -- |
Yield (TTM) | 0.00% |
Forward Yield | -- |
Payout Ratio | 0.00% |
Cash Payout Ratio | -- |
Consistent Payer (5Y) | No |
Consistent Growth (5Y) | No |
Risk
Total Returns Comparison
Annual Total Returns Versus Peers
As of March 24, 2023.
Fundamentals
Revenue (TTM) | 343.79M |
Total Expenses (TTM) | 402.54M |
Net Income (TTM) | 263.93M |
Total Assets (Quarterly) | 127.51M |
Total Liabilities (Quarterly) | 286.98M |
Shareholders Equity (Quarterly) | -159.46M |
2017
2018
2019
2020
2021
4.00
2.00
1.00
Ratings
Profile
Edit
Uxin Ltd is an investment holding company. Along with its subsidiaries, the firm operates used car e-commerce platforms through its mobile applications and websites. It facilitates used car transaction services and financing solutions offered by third-party financing partners to buyers for their used car purchases. The company generates revenue through sales of the commission of salvage car sales, and interest income from the financial lease. |
URL | https://www.xin.com |
Investor Relations URL | https://ir.xin.com/ |
HQ State/Province | N/A |
Sector | Consumer Cyclical |
Industry | Auto & Truck Dealerships |
Equity Style | N/A |
Next Earnings Release | Mar. 29, 2023 (est.) |
Last Earnings Release | Dec. 30, 2022 |
Next Ex-Dividend Date | N/A |
Last Ex-Dividend Date | N/A |
Ownership
Insider Ownership Percentage | Upgrade |
Jul '20
Nov '20
Mar '21
80.00%
40.00%
10.00%
Analyst Coverage
Consensus Rating
|
|
Analyst Recommendation
|
Source: S&P Global
Other Resources
Whale Wisdom | 13F Filings |
Seeking Alpha | Call Transcripts |
Nasdaq | Insider Trading |
Nasdaq | Institutional Ownership |
Nasdaq | Option Chain |
SEC | SEC Filings |
UXIN Tweets |