

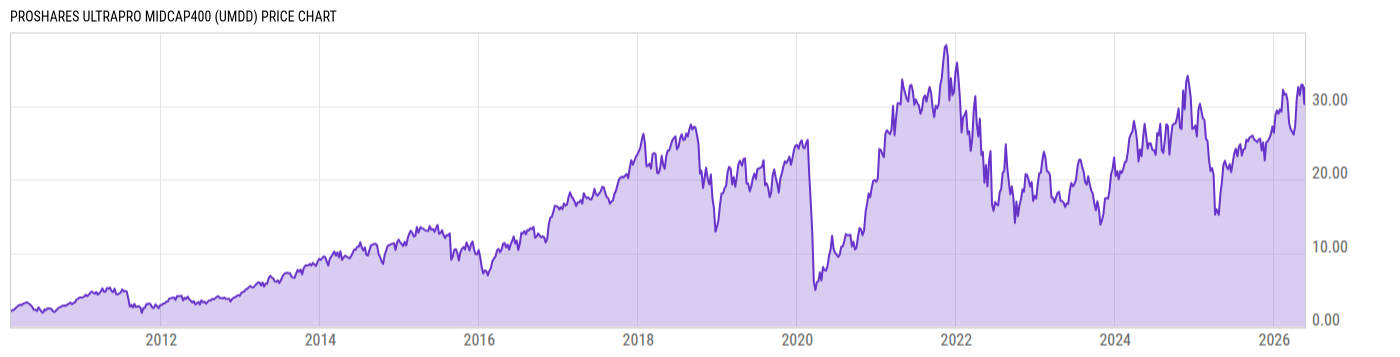
ProShares UltraPro MidCap400 (UMDD)
34.38
+0.81
(+2.40%)
USD |
NYSEARCA |
Jun 09, 16:00
33.75
-0.63
(-1.84%)
After-Hours: 20:00
Price Chart
Key Stats
| Net Expense Ratio | Discount or Premium to NAV | Total Assets Under Management | 30-Day Average Daily Volume |
|---|---|---|---|
| 0.95% | -0.14% | 32.02M | 6668.17 |
| Weighted Average Dividend Yield | Turnover Ratio (Generic) | 1 Year Fund Level Flows | Max Drawdown (Since Inception) |
| 1.38% | 67.00% | -9.596M |
Basic Info
| Investment Strategy | |
| The Fund seeks daily investment results that correspond to triple (300%) the daily performance of the S&P MidCap400 Index. The Fund invest in equity securities and derivatives that the Advisor believes, in combination, should have similar daily performance characteristics as three times the daily return of the index. |
| General | |
| Security Type | Exchange-Traded Fund |
| Equity Style | Small Cap Core |
| Broad Asset Class | Miscellaneous |
| Broad Category | Alternative Strategies |
| Global Peer Group | Alternative Equity Leveraged |
| Peer Group | Equity Leverage Funds |
| Global Macro | Alternative Equity |
| US Macro | Large-Cap Funds |
| YCharts Categorization | -- |
| YCharts Benchmark | -- |
| Prospectus Objective | Equity Leverage Funds |
| Fund Owner Firm Name | ProShares |
| Broad Asset Class Benchmark Index | |
| ^SPXTR | 100.0% |
Performance Versus Peer Group
Annual Total Returns Versus Peers
As of June 10, 2026.
Asset Allocation
As of May 31, 2026.
| Type | % Net |
|---|---|
| Cash | 22.24% |
| Stock | 53.01% |
| Bond | 0.00% |
| Convertible | 0.00% |
| Preferred | 0.00% |
| Other | 24.75% |
Basic Info
| Investment Strategy | |
| The Fund seeks daily investment results that correspond to triple (300%) the daily performance of the S&P MidCap400 Index. The Fund invest in equity securities and derivatives that the Advisor believes, in combination, should have similar daily performance characteristics as three times the daily return of the index. |
| General | |
| Security Type | Exchange-Traded Fund |
| Equity Style | Small Cap Core |
| Broad Asset Class | Miscellaneous |
| Broad Category | Alternative Strategies |
| Global Peer Group | Alternative Equity Leveraged |
| Peer Group | Equity Leverage Funds |
| Global Macro | Alternative Equity |
| US Macro | Large-Cap Funds |
| YCharts Categorization | -- |
| YCharts Benchmark | -- |
| Prospectus Objective | Equity Leverage Funds |
| Fund Owner Firm Name | ProShares |
| Broad Asset Class Benchmark Index | |
| ^SPXTR | 100.0% |