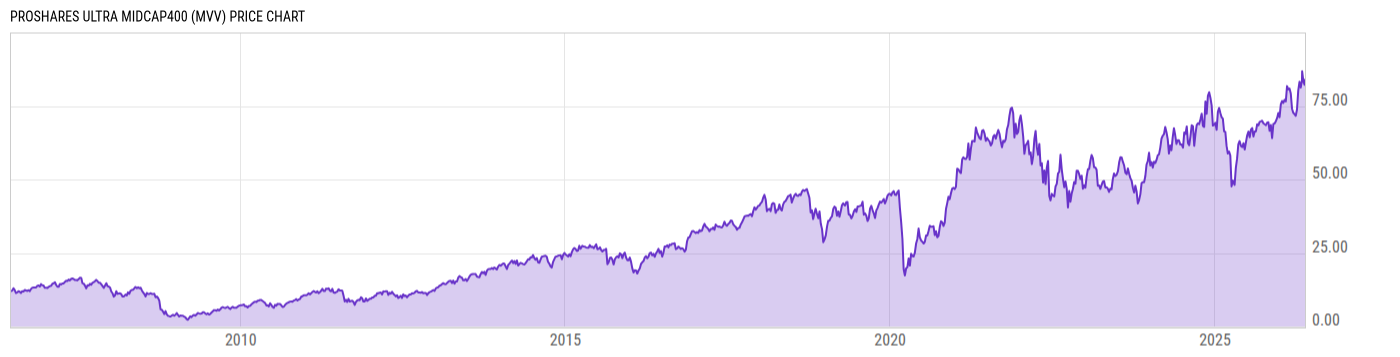
ProShares Ultra MidCap400 (MVV)
58.81
-0.78 (-1.31%)
USD |
NYSEARCA |
Feb 03, 16:00
58.73
-0.08 (-0.14%)
After-Hours: 19:59
Price Chart
Key Stats
Customize
Expense Ratio | Discount or Premium to NAV | Total Assets Under Management | 30-Day Average Daily Volume |
---|---|---|---|
0.95% | 0.01% | 148.47M | 36071.03 |
Dividend Yield | Turnover Ratio | 1 Year Fund Level Flows | Max Drawdown (All) |
0.76% | -- | -6.461M | Upgrade |
Basic Info
Investment Strategy | |
The investment seeks daily investment results, before fees and expenses, that correspond to two times (2x) the daily performance of the S&P MidCap 400®. The fund invests in financial instruments that ProShare Advisors believes, in combination, should produce daily returns consistent with the fund's investment objective. The index is a float-adjusted, market capitalization-weighted index of 400 U.S. operating companies and real estate investment trusts selected through a process that factors in criteria such as liquidity, price, market capitalization, financial viability and public float. The fund is non-diversified. |
General | |
Security Type | Exchange-Traded Fund |
Equity Style | Small Cap/Blend |
Fixed Income Style | -- |
Broad Asset Class | Miscellaneous |
Broad Category | Miscellaneous |
Category Name | Trading--Leveraged Equity |
Category Index | S&P 500 TR USD |
Global Category Name | Trading Tools |
YCharts Categorization | Other |
YCharts Benchmark | S&P 500 Total Return (^SPXTR) |
Prospectus Objective | Growth |
Fund Owner Firm Name | ProShares |
Prospectus Benchmark Index | |
S&P MidCap 400 TR | 200.0% |
Broad Asset Class Benchmark Index | |
^SPXTR | 100.0% |
Manager Tenure | |
Michael Neches | 9.34 yrs |
Devin Sullivan | 4.76 yrs |
Net Fund Flows Versus Category
1 Month
% Rank:
--
--
Category Low
--
Category High
1 Year
% Rank:
72
-6.461M
-564.81M
Category Low
6.331B
Category High
3 Months
% Rank:
--
--
Category Low
--
Category High
3 Years
% Rank:
--
--
Category Low
--
Category High
6 Months
% Rank:
--
--
Category Low
--
Category High
5 Years
% Rank:
--
--
Category Low
--
Category High
YTD
% Rank:
--
--
Category Low
--
Category High
10 Years
% Rank:
--
--
Category Low
--
Category High
As of January 31, 2023
Performance Versus Category
As of February 03, 2023. Returns for periods of 1 year and above are annualized.
Annual Total Returns Versus Peers
As of February 03, 2023.
Asset Allocation
Top 10 Holdings
Name | % Weight | Price | % Change |
---|---|---|---|
S&P Midcap 400 Index Swap Bnp Paribas
|
25.87% | -- | -- |
S&P Midcap 400 Index Swap Societe Generale
|
17.44% | -- | -- |
Spdr S&P Midcap 400 (Mdy) Swap Goldman Sachs International
|
14.54% | -- | -- |
S&P Midcap 400 Index Swap Citibank Na
|
13.27% | -- | -- |
S&P Midcap 400 Index Swap Goldman Sachs International
|
13.27% | -- | -- |
S&P Midcap 400 Index Swap Bank Of America Na
|
9.15% | -- | -- |
S&P Midcap 400 Index Swap Ubs Ag
|
8.88% | -- | -- |
S&P Midcap 400 Index Swap Morgan Stanley & Co. International Plc
|
6.42% | -- | -- |
Tennessee 500 Leg Natural Gas (Platts IFERC) Basis Future Sept 22
|
3.98% | -- | -- |
Targa Resources Corp | 0.64% | 73.41 | -1.82% |
News
Headline
Wire
Time (ET)
Basic Info
Investment Strategy | |
The investment seeks daily investment results, before fees and expenses, that correspond to two times (2x) the daily performance of the S&P MidCap 400®. The fund invests in financial instruments that ProShare Advisors believes, in combination, should produce daily returns consistent with the fund's investment objective. The index is a float-adjusted, market capitalization-weighted index of 400 U.S. operating companies and real estate investment trusts selected through a process that factors in criteria such as liquidity, price, market capitalization, financial viability and public float. The fund is non-diversified. |
General | |
Security Type | Exchange-Traded Fund |
Equity Style | Small Cap/Blend |
Fixed Income Style | -- |
Broad Asset Class | Miscellaneous |
Broad Category | Miscellaneous |
Category Name | Trading--Leveraged Equity |
Category Index | S&P 500 TR USD |
Global Category Name | Trading Tools |
YCharts Categorization | Other |
YCharts Benchmark | S&P 500 Total Return (^SPXTR) |
Prospectus Objective | Growth |
Fund Owner Firm Name | ProShares |
Prospectus Benchmark Index | |
S&P MidCap 400 TR | 200.0% |
Broad Asset Class Benchmark Index | |
^SPXTR | 100.0% |
Manager Tenure | |
Michael Neches | 9.34 yrs |
Devin Sullivan | 4.76 yrs |
Fundamentals
General | |
Distribution Yield | Upgrade |
Dividend Yield TTM (2-3-23) | 0.76% |
30-Day SEC Yield | -- |
7-Day SEC Yield | -- |
Number of Holdings | Upgrade |
Stock | |
Weighted Average PE Ratio | -- |
Weighted Average Price to Sales Ratio | -- |
Weighted Average Price to Book Ratio | -- |
Weighted Median ROE | -- |
Weighted Median ROA | -- |
Forecasted Dividend Yield | Upgrade |
Forecasted PE Ratio | Upgrade |
Forecasted Price to Sales Ratio | Upgrade |
Forecasted Price to Book Ratio | Upgrade |
As of July 31, 2022
Growth Estimates
Fund Details
Key Dates | |
Inception Date | 6/19/2006 |
Last Annual Report Date | 5/31/2022 |
Last Prospectus Date | 10/1/2022 |
Attributes | |
Index Fund |
|
Inverse Fund | No |
Leveraged Fund |
|
Fund of Funds | No |
Currency Hedged Fund | No |
Synthetic Replication Fund | No |
Has Dividend Investment Plan | No |
Socially Responsible Fund | No |
News
Headline
Wire
Time (ET)