

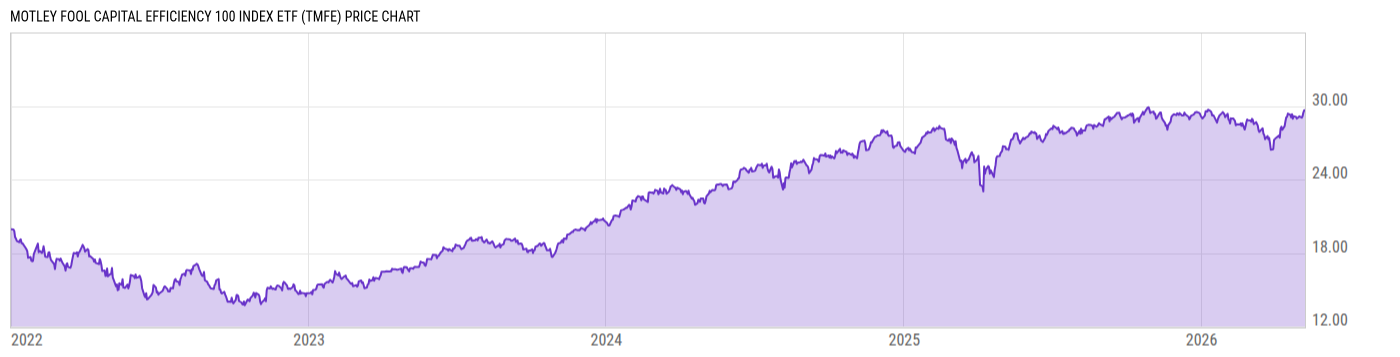
Motley Fool Capital Efficiency 100 Index ETF (TMFE)
30.08
+0.07
(+0.23%)
USD |
BATS |
May 29, 16:00
30.08
0.00 (0.00%)
After-Hours: 19:46
Price Chart
Key Stats
| Net Expense Ratio | Discount or Premium to NAV | Total Assets Under Management | 30-Day Average Daily Volume |
|---|---|---|---|
| 0.50% | -0.05% | 84.82M | 12985.77 |
| Weighted Average Dividend Yield | Turnover Ratio (Generic) | 1 Year Fund Level Flows | Max Drawdown (Since Inception) |
| 0.59% | 33.00% | 486560.0 |
Basic Info
| Investment Strategy | |
| The Fund seeks investment results that correspond generally to the total return performance of the Motley Fool Capital Efficiency 100 Index. The Index is a proprietary, rules-based index designed to track the performance of the highest scoring stocks of US companies, measured by a companys capital efficiency. |
| General | |
| Security Type | Exchange-Traded Fund |
| Equity Style | Large Cap Growth |
| Broad Asset Class | US Equity |
| Broad Category | Equity |
| Global Peer Group | Equity US |
| Peer Group | Large-Cap Growth Funds |
| Global Macro | Equity North America |
| US Macro | Large-Cap Funds |
| YCharts Categorization | -- |
| YCharts Benchmark | -- |
| Prospectus Objective | Growth Funds |
| Fund Owner Firm Name | Motley Fool Asset Management |
| Broad Asset Class Benchmark Index | |
| ^SPXTR | 100.0% |
Performance Versus Peer Group
Annual Total Returns Versus Peers
As of May 29, 2026.
Asset Allocation
As of April 30, 2026.
| Type | % Net |
|---|---|
| Cash | 0.07% |
| Stock | 99.94% |
| Bond | 0.00% |
| Convertible | 0.00% |
| Preferred | 0.00% |
| Other | -0.02% |
Basic Info
| Investment Strategy | |
| The Fund seeks investment results that correspond generally to the total return performance of the Motley Fool Capital Efficiency 100 Index. The Index is a proprietary, rules-based index designed to track the performance of the highest scoring stocks of US companies, measured by a companys capital efficiency. |
| General | |
| Security Type | Exchange-Traded Fund |
| Equity Style | Large Cap Growth |
| Broad Asset Class | US Equity |
| Broad Category | Equity |
| Global Peer Group | Equity US |
| Peer Group | Large-Cap Growth Funds |
| Global Macro | Equity North America |
| US Macro | Large-Cap Funds |
| YCharts Categorization | -- |
| YCharts Benchmark | -- |
| Prospectus Objective | Growth Funds |
| Fund Owner Firm Name | Motley Fool Asset Management |
| Broad Asset Class Benchmark Index | |
| ^SPXTR | 100.0% |