

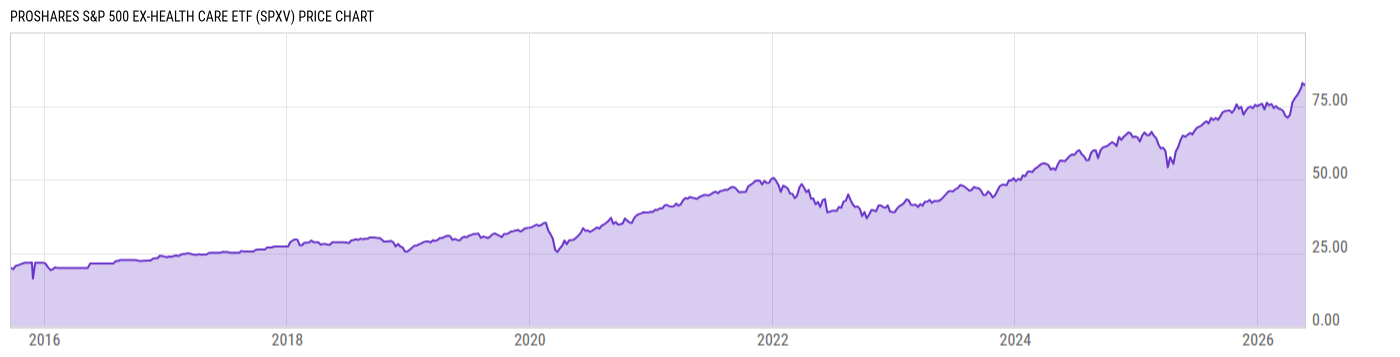
ProShares S&P 500 Ex-Health Care ETF (SPXV)
81.46
+0.04
(+0.04%)
USD |
NYSEARCA |
Jun 08, 16:00
Price Chart
Key Stats
| Net Expense Ratio | Discount or Premium to NAV | Total Assets Under Management | 30-Day Average Daily Volume |
|---|---|---|---|
| 0.09% | 0.00% | 39.10M | 1189.13 |
| Weighted Average Dividend Yield | Turnover Ratio (Generic) | 1 Year Fund Level Flows | Max Drawdown (Since Inception) |
| 0.98% | 4.00% | 1.145M |
Basic Info
| Investment Strategy | |
| The Fund seeks investment results, before fees and expenses, that track the performance of the S&P 500 Ex-Health Care Index. Under normal circumstances, the Fund will invest at least 80% of its total assets in component securities. The Fund will also invest in common stocks issued by public companies. |
| General | |
| Security Type | Exchange-Traded Fund |
| Equity Style | Large Cap Core |
| Broad Asset Class | US Equity |
| Broad Category | Equity |
| Global Peer Group | Equity US |
| Peer Group | Large-Cap Core Funds |
| Global Macro | Equity North America |
| US Macro | Large-Cap Funds |
| YCharts Categorization | -- |
| YCharts Benchmark | -- |
| Prospectus Objective | Growth & Income Funds |
| Fund Owner Firm Name | ProShares |
| Broad Asset Class Benchmark Index | |
| ^SPXTR | 100.0% |
Performance Versus Peer Group
Annual Total Returns Versus Peers
As of June 09, 2026.
Asset Allocation
As of May 31, 2026.
| Type | % Net |
|---|---|
| Cash | 0.15% |
| Stock | 99.78% |
| Bond | 0.00% |
| Convertible | 0.00% |
| Preferred | 0.00% |
| Other | 0.07% |
Basic Info
| Investment Strategy | |
| The Fund seeks investment results, before fees and expenses, that track the performance of the S&P 500 Ex-Health Care Index. Under normal circumstances, the Fund will invest at least 80% of its total assets in component securities. The Fund will also invest in common stocks issued by public companies. |
| General | |
| Security Type | Exchange-Traded Fund |
| Equity Style | Large Cap Core |
| Broad Asset Class | US Equity |
| Broad Category | Equity |
| Global Peer Group | Equity US |
| Peer Group | Large-Cap Core Funds |
| Global Macro | Equity North America |
| US Macro | Large-Cap Funds |
| YCharts Categorization | -- |
| YCharts Benchmark | -- |
| Prospectus Objective | Growth & Income Funds |
| Fund Owner Firm Name | ProShares |
| Broad Asset Class Benchmark Index | |
| ^SPXTR | 100.0% |