

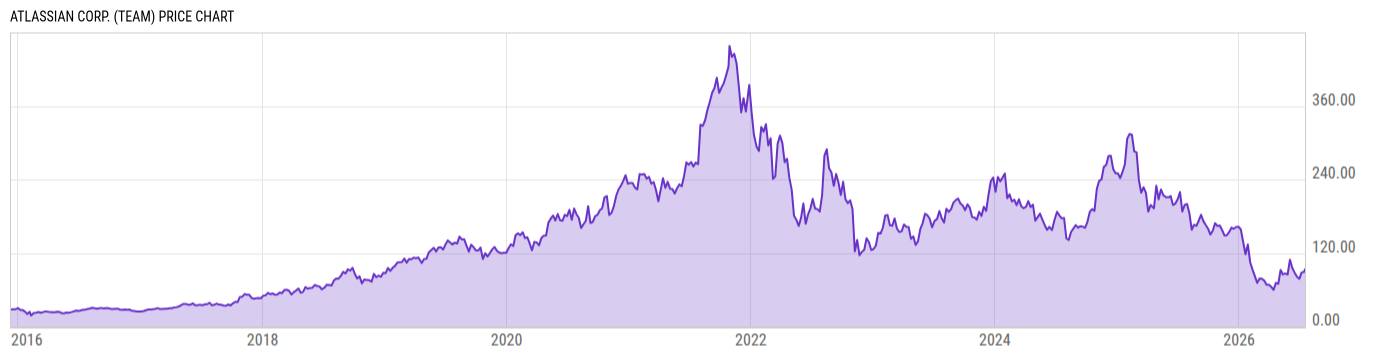
Atlassian Corp. (TEAM)
93.32
+0.96
(+1.04%)
USD |
NASDAQ |
Jul 17, 12:52
Price Chart
Key Stats
| Price and Performance | |
|---|---|
| Market Cap | 23.88B |
| 52 Week High (Daily) | |
| 52 Week Low (Daily) | |
| All-Time High (Daily) | |
| Year to Date Total Returns (Daily) | |
| 1 Month Total Returns (Daily) | |
| 1 Year Total Returns (Daily) | -51.50% |
| Valuation | |
| PE Ratio | -- |
| PE Ratio (Forward) | |
| PS Ratio | 3.960 |
| Price to Book Value | 27.16 |
| EV to EBITDA | |
| Dividend | |
|---|---|
| Dividend | -- |
| Dividend Yield (Forward) | |
| Financials | |
| Revenue (5 Year Growth) | |
| Revenue (Quarterly YoY Growth) | |
| EPS Diluted (5 Year Growth) | |
| EPS Diluted (Quarterly YoY Growth) | |
| Debt to Equity Ratio | 1.414 |
| Return on Equity | |
| Return on Assets | |
| Risk | |
| Beta (5Y) | |
| Max Drawdown (5Y) | 87.53% |
Profile
| Atlassian Corp. is a holding company, which engages in providing team collaboration and productivity software. Its products include Jira Software, Confluence, Jira Service Management, and Loom. The company was founded by Michael Cannon-Brookes and Scott Farquhar in October 2002 and is headquartered in San Francisco, CA. |
| URL | http://www.atlassian.com |
| Investor Relations URL | https://investors.atlassian.com/ |
| HQ State/Province | California |
| Sector | Information Technology |
| Industry | Software |
| Equity Style | Small Cap Growth |
| Next Earnings Release | Aug. 06, 2026 |
| Last Earnings Release | Apr. 30, 2026 |
| Next Ex-Dividend Date | N/A |
| Last Ex-Dividend Date | N/A |