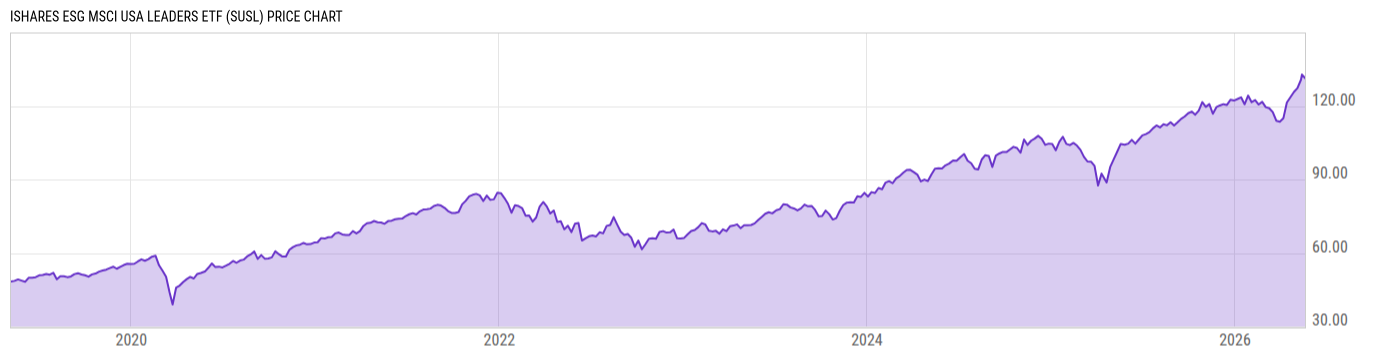
iShares ESG MSCI USA Leaders ETF (SUSL)
74.08
-0.04 (-0.05%)
USD |
NASDAQ |
Aug 18, 12:09
Price Chart
Key Stats
Customize
Expense Ratio | Discount or Premium to NAV | Total Assets Under Management | 30-Day Average Daily Volume |
---|---|---|---|
0.10% | -0.02% | 3.414B | 40176.80 |
Dividend Yield | Turnover Ratio | 1 Year Fund Level Flows | Max Drawdown (All) |
1.31% | 12.00% | -260.21M | Upgrade |
Basic Info
Investment Strategy | |
The investment seeks to track the investment results of the MSCI USA Extended ESG Leaders Index. The fund generally will invest at least 90% of its assets in the component securities of the underlying index and may invest up to 10% of its assets in certain futures, options and swap contracts, cash and cash equivalents. The underlying index is a free float-adjusted market capitalization-weighted index designed to reflect the equity performance of U.S. companies that have favorable environmental, social and governance (“ESG”) characteristics. It is non-diversified. |
General | |
Security Type | Exchange-Traded Fund |
Equity Style | Large Cap/Growth |
Fixed Income Style | -- |
Broad Asset Class | US Equity |
Broad Category | Equity |
Category Name | Large Blend |
Category Index | Russell 1000 TR USD |
Prospectus Objective | Specialty - Unaligned |
Fund Owner Firm Name | iShares |
Prospectus Benchmark Index | |
MSCI USA Extended ESG Leaders GR USD | 100.0% |
Broad Asset Class Benchmark Index | |
^SPXTR | 100.0% |
Manager Tenure | |
Amy Whitelaw | 3.24 yrs |
Greg Savage | 3.24 yrs |
Jennifer Hsui | 3.24 yrs |
Paul Whitehead | 0.58 yrs |
Net Fund Flows Versus Category
1 Month
% Rank:
--
--
Category Low
--
Category High
1 Year
% Rank:
78
-260.21M
-21.21B
Category Low
44.66B
Category High
3 Months
% Rank:
--
--
Category Low
--
Category High
3 Years
% Rank:
--
--
Category Low
--
Category High
6 Months
% Rank:
--
--
Category Low
--
Category High
5 Years
% Rank:
--
--
Category Low
--
Category High
YTD
% Rank:
--
--
Category Low
--
Category High
10 Years
% Rank:
--
--
Category Low
--
Category High
As of July 31, 2022
Performance Versus Category
As of August 17, 2022. Returns for periods of 1 year and above are annualized.
Annual Total Returns Versus Peers
As of August 17, 2022.
Asset Allocation
Top 10 Holdings
Name | % Weight | Price | % Change |
---|---|---|---|
Microsoft Corp | 10.88% | 291.29 | -0.01% |
Tesla Inc | 4.22% | 916.73 | 0.52% |
Alphabet Inc Class A | 3.82% | 120.55 | 0.84% |
Alphabet Inc Class C | 3.63% | 121.43 | 0.92% |
NVIDIA Corp | 2.46% | 188.30 | 2.70% |
Johnson & Johnson | 2.30% | 166.77 | -0.48% |
Visa Inc Class A | 1.88% | 215.16 | 0.30% |
Procter & Gamble Co | 1.88% | 148.90 | -0.23% |
The Home Depot Inc | 1.78% | 323.46 | -0.71% |
Mastercard Inc Class A | 1.64% | 358.18 | 0.80% |
News
Headline
Wire
Time (ET)
SA Breaking News
06/09 13:43
SA Breaking News
07/04 13:15
SA Breaking News
06/17 13:00
SA Breaking News
06/10 13:56
Basic Info
Investment Strategy | |
The investment seeks to track the investment results of the MSCI USA Extended ESG Leaders Index. The fund generally will invest at least 90% of its assets in the component securities of the underlying index and may invest up to 10% of its assets in certain futures, options and swap contracts, cash and cash equivalents. The underlying index is a free float-adjusted market capitalization-weighted index designed to reflect the equity performance of U.S. companies that have favorable environmental, social and governance (“ESG”) characteristics. It is non-diversified. |
General | |
Security Type | Exchange-Traded Fund |
Equity Style | Large Cap/Growth |
Fixed Income Style | -- |
Broad Asset Class | US Equity |
Broad Category | Equity |
Category Name | Large Blend |
Category Index | Russell 1000 TR USD |
Prospectus Objective | Specialty - Unaligned |
Fund Owner Firm Name | iShares |
Prospectus Benchmark Index | |
MSCI USA Extended ESG Leaders GR USD | 100.0% |
Broad Asset Class Benchmark Index | |
^SPXTR | 100.0% |
Manager Tenure | |
Amy Whitelaw | 3.24 yrs |
Greg Savage | 3.24 yrs |
Jennifer Hsui | 3.24 yrs |
Paul Whitehead | 0.58 yrs |
Fundamentals
General | |
Distribution Yield | Upgrade |
Dividend Yield TTM (8-18-22) | 1.31% |
30-Day SEC Yield (6-30-22) | Upgrade |
7-Day SEC Yield | -- |
Number of Holdings | Upgrade |
Stock | |
Weighted Average PE Ratio | 21.88 |
Weighted Average Price to Sales Ratio | Upgrade |
Weighted Average Price to Book Ratio | Upgrade |
Weighted Median ROE | Upgrade |
Weighted Median ROA | Upgrade |
Forecasted Dividend Yield | Upgrade |
Forecasted PE Ratio | Upgrade |
Forecasted Price to Sales Ratio | Upgrade |
Forecasted Price to Book Ratio | Upgrade |
As of August 16, 2022
Growth Estimates
Fund Details
Key Dates | |
Inception Date | 5/7/2019 |
Last Annual Report Date | 8/31/2021 |
Last Prospectus Date | 12/30/2021 |
Attributes | |
Enhanced Index Fund | No |
Index Fund |
|
Inverse Fund | No |
Leveraged Fund | No |
Fund of Funds | No |
Currency Hedged Fund | No |
Synthetic Replication Fund | No |
Has Dividend Investment Plan | No |
Socially Responsible Fund |
|
News
Headline
Wire
Time (ET)
SA Breaking News
06/09 13:43
SA Breaking News
07/04 13:15
SA Breaking News
06/17 13:00
SA Breaking News
06/10 13:56