

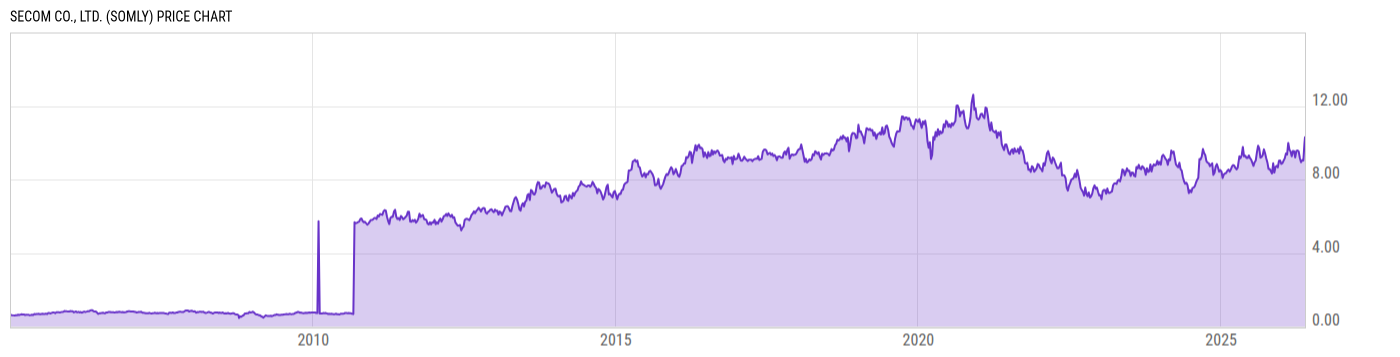
SECOM Co., Ltd. (SOMLY)
10.30
+0.21
(+2.08%)
USD |
OTCM |
May 22, 15:47
Price Chart
Key Stats
| Price and Performance | |
|---|---|
| Market Cap | 16.98B |
| 52 Week High (Daily) | |
| 52 Week Low (Daily) | |
| All-Time High (Daily) | |
| Year to Date Total Returns (Daily) | |
| 1 Month Total Returns (Daily) | |
| 1 Year Total Returns (Daily) | 8.49% |
| Valuation | |
| PE Ratio | 22.57 |
| PE Ratio (Forward) | |
| PS Ratio | 2.032 |
| Price to Book Value | 2.055 |
| EV to EBITDA | |
| Dividend | |
|---|---|
| Dividend | -- |
| Dividend Yield (Forward) | |
| Financials | |
| Revenue (5 Year Growth) | |
| Revenue (Quarterly YoY Growth) | |
| EPS Diluted (5 Year Growth) | |
| EPS Diluted (Quarterly YoY Growth) | |
| Debt to Equity Ratio | 0.0521 |
| Return on Equity | |
| Return on Assets | |
| Risk | |
| Beta (5Y) | |
| Max Drawdown (5Y) | 45.22% |
Profile
| SECOM Co., Ltd. engages in the provision of security services. It operates through the following segments: Security Services, Fire Protection Services, Medical Services, Insurance Services, Geographic Information Services, Information and Communication Related Services, and Real Estate and Others. The Security Services segment provides centralized online commercial, home security, and large-scale proprietary security systems. The Fire Protection Services segment focuses on fire protection equipment such as automatic fire alarm and fire extinguishing systems for office buildings, plants, tunnels, ships, residences, and cultural properties. The Medical Services segment deals with pharmaceutical dispensing and home nursing services, as well as the operation of residences for seniors, electronic medical report systems, medical equipment sales, personal care services, and real estate leasing for hospitals and healthcare-related institutions. The Insurance Services segment sells non-life insurance policies and treatment products in overcoming cancer. The Geographic Information Services segment collects satellite and aerial geospatial data, and provides them to national and foreign governments. The Information and Communication Related Services segment includes information security and network system operations, and system construction. The Real Estate and Others segment develops, leases and sells real estate. It is also engaged in construction and hotel businesses. The company was founded by Makoto Iida and Juichi Toda on July 7, 1962 and is headquartered in Tokyo, Japan. |
| URL | http://www.secom.co.jp |
| Investor Relations URL | https://www.secom.co.jp/english/ir/ |
| HQ State/Province | Tokyo |
| Sector | Industrials |
| Industry | Commercial Services & Supplies |
| Next Earnings Release | Aug. 07, 2026 (est.) |
| Last Earnings Release | May. 12, 2026 |
| Next Ex-Dividend Date | N/A |
| Last Ex-Dividend Date | Sep. 26, 2018 |