

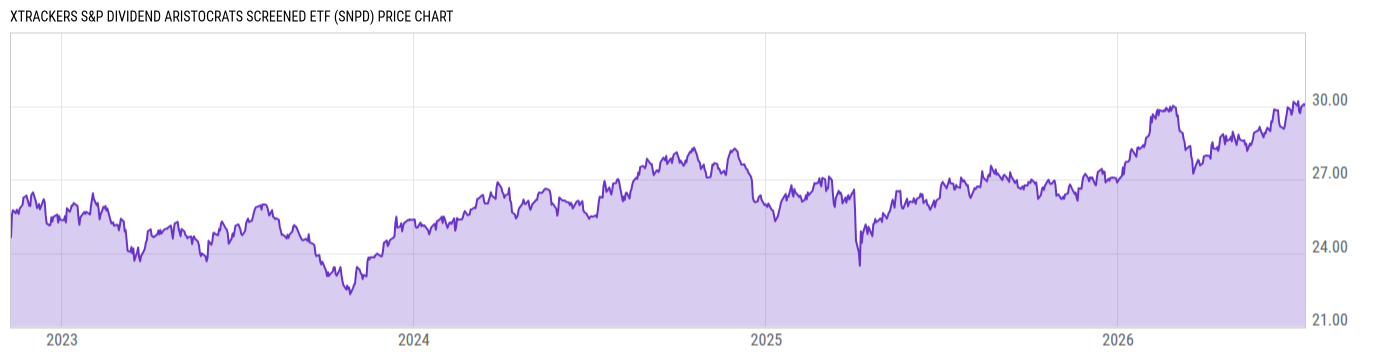
Xtrackers S&P Dividend Aristocrats Screened ETF (SNPD)
30.02
-0.06
(-0.19%)
USD |
BATS |
Jul 14, 16:00
Price Chart
Key Stats
| Net Expense Ratio | Discount or Premium to NAV | Total Assets Under Management | 30-Day Average Daily Volume |
|---|---|---|---|
| 0.15% | 0.15% | 2.698M | 735.70 |
| Weighted Average Dividend Yield | Turnover Ratio (Generic) | 1 Year Fund Level Flows | Max Drawdown (Since Inception) |
| 3.34% | 31.00% | -3.766M |
Basic Info
| Investment Strategy | |
| The Fund seeks investment results that correspond generally to the performance, before fees and expenses, of the S&P ESG High Yield Dividend Aristocrats Index. The Index measures the performance of companies within the S&P Composite 1500 Index that have followed a policy of consistently increasing dividends every year. |
| General | |
| Security Type | Exchange-Traded Fund |
| Equity Style | Multi Cap Value |
| Broad Asset Class | US Equity |
| Broad Category | Equity |
| Global Peer Group | Equity US |
| Peer Group | Multi-Cap Value Funds |
| Global Macro | Equity North America |
| US Macro | Multi-Cap Funds |
| YCharts Categorization | -- |
| YCharts Benchmark | -- |
| Prospectus Objective | -- |
| Fund Owner Firm Name | DWS |
| Broad Asset Class Benchmark Index | |
| ^SPXTR | 100.0% |
Performance Versus Peer Group
Annual Total Returns Versus Peers
As of July 15, 2026.
Asset Allocation
As of May 31, 2026.
| Type | % Net |
|---|---|
| Cash | 0.34% |
| Stock | 99.64% |
| Bond | 0.02% |
| Convertible | 0.00% |
| Preferred | 0.00% |
| Other | 0.00% |
Basic Info
| Investment Strategy | |
| The Fund seeks investment results that correspond generally to the performance, before fees and expenses, of the S&P ESG High Yield Dividend Aristocrats Index. The Index measures the performance of companies within the S&P Composite 1500 Index that have followed a policy of consistently increasing dividends every year. |
| General | |
| Security Type | Exchange-Traded Fund |
| Equity Style | Multi Cap Value |
| Broad Asset Class | US Equity |
| Broad Category | Equity |
| Global Peer Group | Equity US |
| Peer Group | Multi-Cap Value Funds |
| Global Macro | Equity North America |
| US Macro | Multi-Cap Funds |
| YCharts Categorization | -- |
| YCharts Benchmark | -- |
| Prospectus Objective | -- |
| Fund Owner Firm Name | DWS |
| Broad Asset Class Benchmark Index | |
| ^SPXTR | 100.0% |